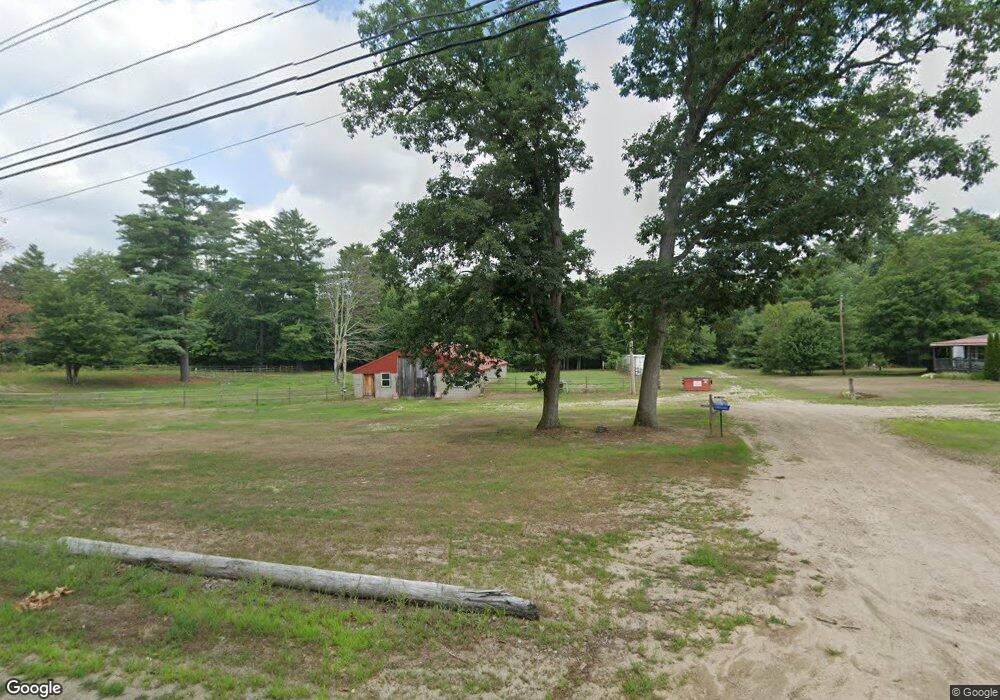
861 Raymond Rd Chester, NH 03036
Estimated Value: $433,000 - $488,000
2
Beds
1
Bath
896
Sq Ft
$522/Sq Ft
Est. Value
About This Home
This home is located at 861 Raymond Rd, Chester, NH 03036 and is currently estimated at $467,287, approximately $521 per square foot. 861 Raymond Rd is a home located in Rockingham County with nearby schools including Chester Academy, Pinkerton Academy, and Busche Academy.
Ownership History
Date
Name
Owned For
Owner Type
Purchase Details
Closed on
Aug 11, 2009
Sold by
Kurisko Rhonda S
Bought by
Bellemore Richard O
Current Estimated Value
Home Financials for this Owner
Home Financials are based on the most recent Mortgage that was taken out on this home.
Original Mortgage
$155,000
Outstanding Balance
$102,393
Interest Rate
5.47%
Mortgage Type
Purchase Money Mortgage
Estimated Equity
$364,894
Purchase Details
Closed on
Feb 2, 1996
Sold by
Dunn Arthur B
Bought by
Kurisko Brant M and Kurisko Rhonda S
Home Financials for this Owner
Home Financials are based on the most recent Mortgage that was taken out on this home.
Original Mortgage
$82,450
Interest Rate
7.25%
Create a Home Valuation Report for This Property
The Home Valuation Report is an in-depth analysis detailing your home's value as well as a comparison with similar homes in the area
Home Values in the Area
Average Home Value in this Area
Purchase History
| Date | Buyer | Sale Price | Title Company |
|---|---|---|---|
| Bellemore Richard O | $191,000 | -- | |
| Kurisko Brant M | $85,000 | -- |
Source: Public Records
Mortgage History
| Date | Status | Borrower | Loan Amount |
|---|---|---|---|
| Open | Kurisko Brant M | $155,000 | |
| Previous Owner | Kurisko Brant M | $13,000 | |
| Previous Owner | Kurisko Brant M | $82,450 |
Source: Public Records
Tax History Compared to Growth
Tax History
| Year | Tax Paid | Tax Assessment Tax Assessment Total Assessment is a certain percentage of the fair market value that is determined by local assessors to be the total taxable value of land and additions on the property. | Land | Improvement |
|---|---|---|---|---|
| 2024 | $5,747 | $351,300 | $136,900 | $214,400 |
| 2023 | $5,399 | $232,700 | $95,100 | $137,600 |
| 2022 | $4,980 | $232,700 | $95,100 | $137,600 |
| 2021 | $4,849 | $232,700 | $95,100 | $137,600 |
| 2020 | $2,712 | $232,700 | $95,100 | $137,600 |
| 2019 | $7,642 | $232,700 | $95,100 | $137,600 |
| 2018 | $2,207 | $189,700 | $77,800 | $111,900 |
| 2016 | $5,430 | $184,200 | $77,800 | $106,400 |
| 2015 | $4,467 | $181,300 | $77,800 | $103,500 |
| 2014 | $4,634 | $181,300 | $77,800 | $103,500 |
Source: Public Records
Map
Nearby Homes