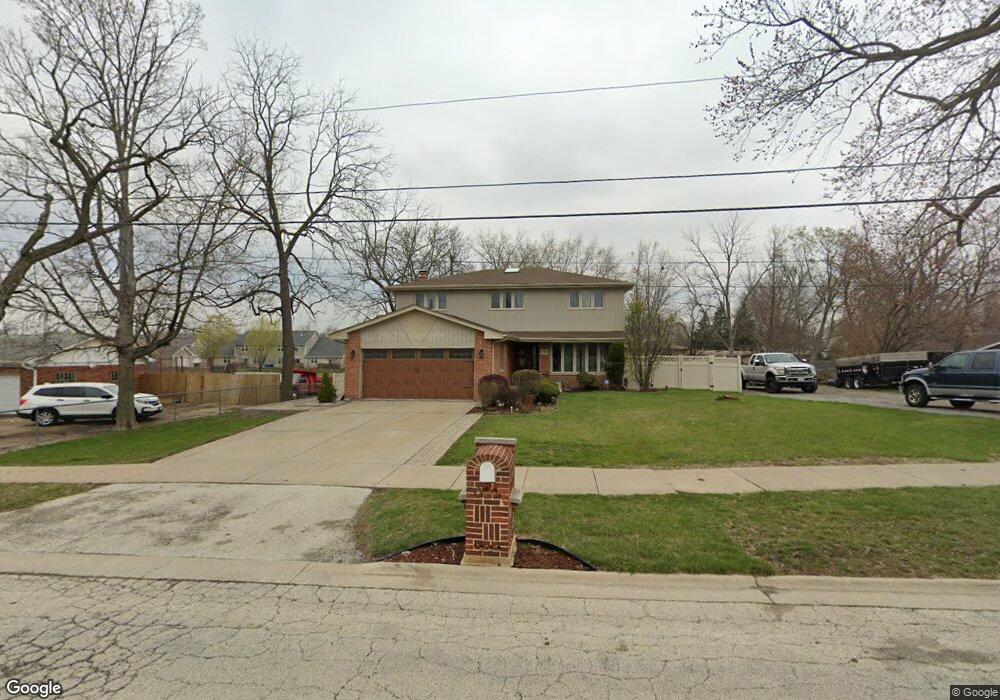
8610 W 75th St Justice, IL 60458
Estimated Value: $387,000 - $447,000
4
Beds
2
Baths
2,296
Sq Ft
$186/Sq Ft
Est. Value
About This Home
This home is located at 8610 W 75th St, Justice, IL 60458 and is currently estimated at $426,532, approximately $185 per square foot. 8610 W 75th St is a home located in Cook County with nearby schools including Frank A Brodnicki Elementary School, Argo Community High School, and St. Patricia School.
Ownership History
Date
Name
Owned For
Owner Type
Purchase Details
Closed on
Jun 14, 2006
Sold by
Machaj Miroslaw and Machaj Elizabeth
Bought by
Bobak Andrzej and Bobak Elzbieta
Current Estimated Value
Home Financials for this Owner
Home Financials are based on the most recent Mortgage that was taken out on this home.
Original Mortgage
$244,000
Outstanding Balance
$144,333
Interest Rate
6.68%
Mortgage Type
Unknown
Estimated Equity
$282,199
Purchase Details
Closed on
Feb 25, 1999
Sold by
Kalchbrenner Russell J
Bought by
Machaj Miroslaw and Machaj Elizabeth
Home Financials for this Owner
Home Financials are based on the most recent Mortgage that was taken out on this home.
Original Mortgage
$144,000
Interest Rate
6.83%
Purchase Details
Closed on
Feb 9, 1998
Sold by
Kalchbrenner Victoria M
Bought by
Kalchbrenner Russell J
Create a Home Valuation Report for This Property
The Home Valuation Report is an in-depth analysis detailing your home's value as well as a comparison with similar homes in the area
Home Values in the Area
Average Home Value in this Area
Purchase History
| Date | Buyer | Sale Price | Title Company |
|---|---|---|---|
| Bobak Andrzej | $365,000 | 1St American Title | |
| Machaj Miroslaw | $204,000 | -- | |
| Kalchbrenner Russell J | -- | -- |
Source: Public Records
Mortgage History
| Date | Status | Borrower | Loan Amount |
|---|---|---|---|
| Open | Bobak Andrzej | $244,000 | |
| Previous Owner | Machaj Miroslaw | $144,000 |
Source: Public Records
Tax History Compared to Growth
Tax History
| Year | Tax Paid | Tax Assessment Tax Assessment Total Assessment is a certain percentage of the fair market value that is determined by local assessors to be the total taxable value of land and additions on the property. | Land | Improvement |
|---|---|---|---|---|
| 2024 | $9,493 | $34,000 | $7,331 | $26,669 |
| 2023 | $8,259 | $34,000 | $7,331 | $26,669 |
| 2022 | $8,259 | $26,390 | $5,138 | $21,252 |
| 2021 | $7,888 | $26,389 | $5,138 | $21,251 |
| 2020 | $7,692 | $26,389 | $6,375 | $20,014 |
| 2019 | $8,960 | $28,168 | $5,737 | $22,431 |
| 2018 | $8,904 | $29,163 | $5,737 | $23,426 |
| 2017 | $8,846 | $29,163 | $5,737 | $23,426 |
| 2016 | $7,736 | $25,642 | $5,100 | $20,542 |
| 2015 | $7,527 | $25,642 | $5,100 | $20,542 |
| 2014 | $7,396 | $25,642 | $5,100 | $20,542 |
| 2013 | $7,766 | $28,972 | $5,100 | $23,872 |
Source: Public Records
Map
Nearby Homes
- 7451 S 86th Ave
- 7425 Covington Place
- 7423 Covington Place
- 7421 Covington Place
- 8643 W 73rd Place
- 7526 Cork Ave
- 7304 Maple Dr Unit 627304
- 7666 S 88th Ct Unit 22P22
- 7420 Maple Dr Unit 547420
- 7242 Terrace Dr Unit 457242
- 7254 Terrace Dr Unit 47
- 7137 S 87th Ave
- 7549 Banks St
- 7256 Bradford Ct Unit 1327256
- 7314 Blackstone Ave Unit 30
- 8751 W 79th St Unit 1
- 8453 W 79th St
- 7716 Cronin Ave
- 7926 S 83rd Ct
- 7700 Garden Ln
- 1110 75th St
- 8620 W 75th St
- 8600 W 75th St
- 8631 W 75th St
- 8621 W 75th St
- 8608 Huntington Ct
- 7460 S 86th Ave
- 7452 S 86th Ave
- 8611 W 75th St
- 8640 W 75th St
- 7434 Covington Dr
- 8601 W 75th St
- 1110 W 75th St
- 8646 Covington Dr
- 7432 Covington Dr
- 8644 W 75th St
- 7444 S 86th Ave
- 8648 Covington Dr
- 8650 Covington Dr
- 8652 Covington Dr