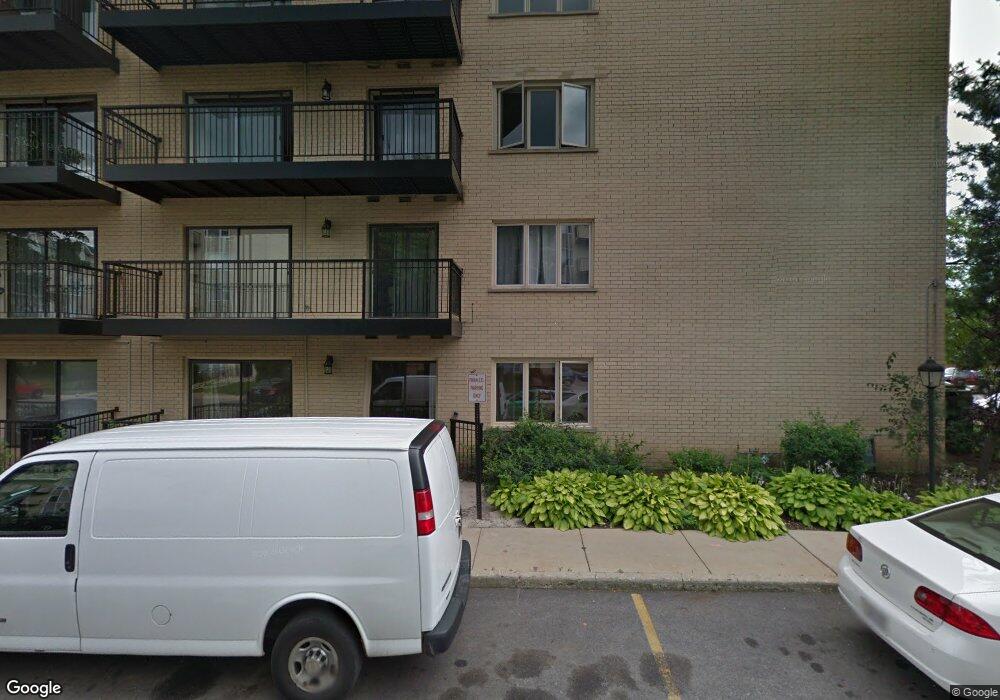
8610 Waukegan Rd Unit 109W Morton Grove, IL 60053
Estimated Value: $254,211 - $294,000
2
Beds
--
Bath
201,600
Sq Ft
$1/Sq Ft
Est. Value
About This Home
This home is located at 8610 Waukegan Rd Unit 109W, Morton Grove, IL 60053 and is currently estimated at $278,553, approximately $1 per square foot. 8610 Waukegan Rd Unit 109W is a home located in Cook County with nearby schools including Hynes Elementary School, Golf Middle School, and Niles North High School.
Ownership History
Date
Name
Owned For
Owner Type
Purchase Details
Closed on
Nov 28, 2018
Sold by
Plemich Robin
Bought by
Plemich Robin and Robin Plemich Declaration Of Trust
Current Estimated Value
Purchase Details
Closed on
Mar 24, 2018
Sold by
Peterson Philip
Bought by
Peterson Philip J and Peterson Mary
Purchase Details
Closed on
May 19, 2006
Sold by
Nguyen Nina
Bought by
Peterson Myra
Purchase Details
Closed on
May 25, 2002
Sold by
Hamai Sadako and Matsushita Misayo J
Bought by
Nguyen Nina
Home Financials for this Owner
Home Financials are based on the most recent Mortgage that was taken out on this home.
Original Mortgage
$166,500
Interest Rate
6.82%
Purchase Details
Closed on
Oct 5, 1993
Sold by
Matsushita Misayo Jean
Bought by
Matsushita Misayo J
Create a Home Valuation Report for This Property
The Home Valuation Report is an in-depth analysis detailing your home's value as well as a comparison with similar homes in the area
Home Values in the Area
Average Home Value in this Area
Purchase History
| Date | Buyer | Sale Price | Title Company |
|---|---|---|---|
| Plemich Robin | -- | Attorney | |
| Peterson Philip J | -- | Attorney | |
| Peterson Myra | $233,000 | First American Title | |
| Nguyen Nina | $185,000 | Chicago Title Insurance Co | |
| Matsushita Misayo J | -- | -- |
Source: Public Records
Mortgage History
| Date | Status | Borrower | Loan Amount |
|---|---|---|---|
| Previous Owner | Nguyen Nina | $166,500 |
Source: Public Records
Tax History Compared to Growth
Tax History
| Year | Tax Paid | Tax Assessment Tax Assessment Total Assessment is a certain percentage of the fair market value that is determined by local assessors to be the total taxable value of land and additions on the property. | Land | Improvement |
|---|---|---|---|---|
| 2024 | $5,176 | $19,027 | $675 | $18,352 |
| 2023 | $4,945 | $19,027 | $675 | $18,352 |
| 2022 | $4,945 | $19,027 | $675 | $18,352 |
| 2021 | $4,379 | $14,786 | $475 | $14,311 |
| 2020 | $4,300 | $14,786 | $475 | $14,311 |
| 2019 | $4,312 | $16,504 | $475 | $16,029 |
| 2018 | $4,044 | $13,905 | $412 | $13,493 |
| 2017 | $4,059 | $13,905 | $412 | $13,493 |
| 2016 | $3,839 | $13,905 | $412 | $13,493 |
| 2015 | $3,372 | $11,139 | $350 | $10,789 |
| 2014 | $1,923 | $11,139 | $350 | $10,789 |
| 2013 | $1,935 | $11,139 | $350 | $10,789 |
Source: Public Records
Map
Nearby Homes
- 8630 Waukegan Rd Unit 316
- 8620 Waukegan Rd Unit 308
- 8661 N National Ave
- 7226 W Greenleaf St
- 8927 Belleforte Ave
- 8929 Cherry Ave
- 7349 W Crain St
- 6956 W Seward St
- 6638 Hazel St
- 8760 N Oketo Ave
- 6914 W Oakton Ct
- 6936 W Oakton Ct
- 7401 W Main St
- 7415 W Main St
- 6411 Elm St
- 8380 Miami Ave
- 8206 N Octavia Ave
- 6330 Lincoln Ave Unit 2E
- 6330 Lincoln Ave Unit 2A
- 6346 Hennings Ct
- 8610 Waukegan Rd Unit 107W
- 8610 Waukegan Rd Unit 308W
- 8610 Waukegan Rd Unit 105W
- 8610 Waukegan Rd Unit 205W
- 8610 Waukegan Rd Unit 505W
- 8610 Waukegan Rd Unit 504W
- 8610 Waukegan Rd Unit 210W
- 8610 Waukegan Rd Unit 408W
- 8610 Waukegan Rd Unit 405W
- 8610 Waukegan Rd Unit 402W
- 8610 Waukegan Rd Unit 404W
- 8610 Waukegan Rd Unit 206W
- 8610 Waukegan Rd Unit 102W
- 8610 Waukegan Rd Unit 303W
- 8610 Waukegan Rd Unit 409W
- 8610 Waukegan Rd Unit 204W
- 8610 Waukegan Rd Unit 310W
- 8610 Waukegan Rd Unit 502W
- 8610 Waukegan Rd Unit 302W
- 8610 Waukegan Rd Unit 508W