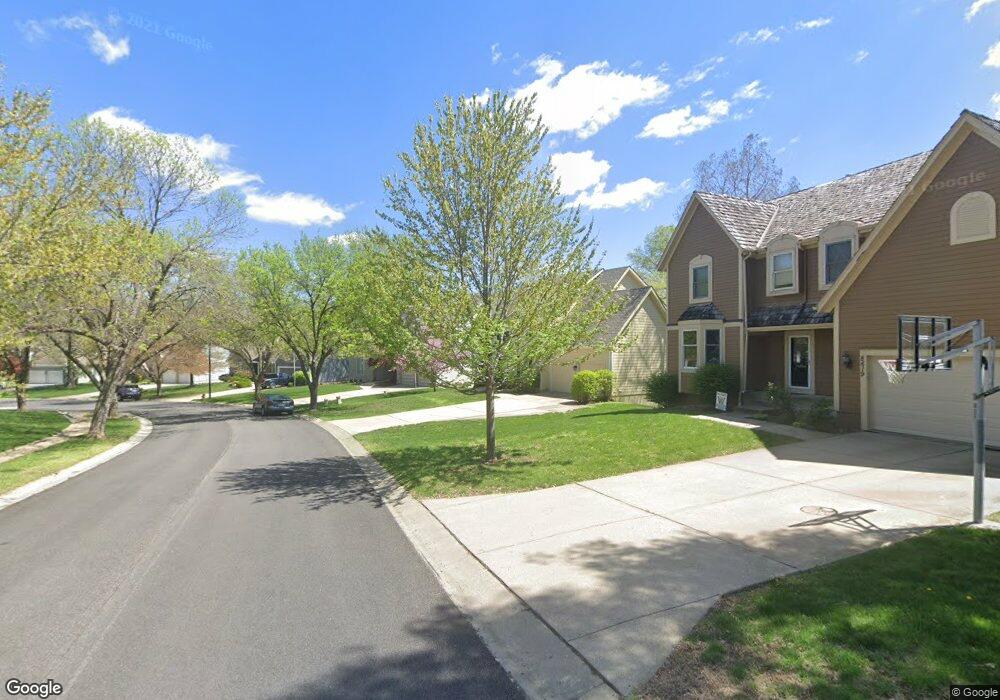
8611 Hallet St Lenexa, KS 66215
Estimated Value: $526,213 - $567,000
4
Beds
5
Baths
2,968
Sq Ft
$185/Sq Ft
Est. Value
About This Home
This home is located at 8611 Hallet St, Lenexa, KS 66215 and is currently estimated at $548,803, approximately $184 per square foot. 8611 Hallet St is a home located in Johnson County with nearby schools including Rising Star Elementary School, Westridge Middle School, and Shawnee Mission West High School.
Ownership History
Date
Name
Owned For
Owner Type
Purchase Details
Closed on
Jun 5, 2019
Sold by
Wroten Milton Price and Wroten Leota Fay
Bought by
Wroten Milton Price and Wroten Leota Fay
Current Estimated Value
Home Financials for this Owner
Home Financials are based on the most recent Mortgage that was taken out on this home.
Original Mortgage
$570,000
Outstanding Balance
$564,419
Interest Rate
4.26%
Mortgage Type
Reverse Mortgage Home Equity Conversion Mortgage
Estimated Equity
-$15,616
Purchase Details
Closed on
Aug 7, 2015
Sold by
Wroten Milton P and Wroten Leota F
Bought by
The Milton Price Wroten & Leota Fay Wrot
Purchase Details
Closed on
Sep 17, 2002
Sold by
Daniel Bruce E and Daniel Lina J
Bought by
Wroten Milton P and Wroten Leota F
Home Financials for this Owner
Home Financials are based on the most recent Mortgage that was taken out on this home.
Original Mortgage
$100,000
Interest Rate
5.25%
Create a Home Valuation Report for This Property
The Home Valuation Report is an in-depth analysis detailing your home's value as well as a comparison with similar homes in the area
Home Values in the Area
Average Home Value in this Area
Purchase History
| Date | Buyer | Sale Price | Title Company |
|---|---|---|---|
| Wroten Milton Price | -- | Non Available | |
| The Milton Price Wroten & Leota Fay Wrot | -- | None Available | |
| Wroten Milton P | -- | Assured Quality Title Co |
Source: Public Records
Mortgage History
| Date | Status | Borrower | Loan Amount |
|---|---|---|---|
| Open | Wroten Milton Price | $570,000 | |
| Closed | Wroten Milton P | $100,000 |
Source: Public Records
Tax History
| Year | Tax Paid | Tax Assessment Tax Assessment Total Assessment is a certain percentage of the fair market value that is determined by local assessors to be the total taxable value of land and additions on the property. | Land | Improvement |
|---|---|---|---|---|
| 2025 | $5,999 | $59,168 | $11,690 | $47,478 |
| 2024 | $5,999 | $54,107 | $10,634 | $43,473 |
| 2023 | $6,082 | $54,061 | $10,634 | $43,427 |
| 2022 | $5,373 | $47,725 | $9,711 | $38,014 |
| 2021 | $5,098 | $43,056 | $8,800 | $34,256 |
| 2020 | $5,029 | $42,056 | $8,800 | $33,256 |
| 2019 | $5,000 | $41,803 | $7,579 | $34,224 |
| 2018 | $4,860 | $40,274 | $7,579 | $32,695 |
| 2017 | $4,827 | $38,779 | $7,579 | $31,200 |
| 2016 | $4,671 | $37,054 | $7,579 | $29,475 |
| 2015 | $4,461 | $35,628 | $7,579 | $28,049 |
| 2013 | -- | $32,143 | $7,579 | $24,564 |
Source: Public Records
Map
Nearby Homes
- 14112 W 87th Terrace
- 8362 Oakview Cir
- 8740 Park St
- 8443 Alden St
- 8834 Candlelight Ln
- 14640 W 90th St
- 8914 Country Hill Ct
- 8403 Swarner Dr
- 8221 Park St
- 14925 W 82nd Terrace
- 13511 W 82nd St
- 8041 Acuff Ln
- 13204 W 85th Ct
- 13212 W 84th St
- 14900 W 91st Terrace
- 8211 Caenen Lake Rd
- 8003 Mullen Rd
- 8004 Constance St
- 15514 W 89th St
- 8221 Noland Rd
- 8615 Hallet St
- 8607 Hallet St
- 8619 Hallet St
- 8601 Hallet St
- 8610 Hallet St
- 8543 Hallet St
- 8629 Greenwood Ln
- 8633 Greenwood Ln
- 8604 Hallet St
- 8617 Greenwood Ln
- 8608 Hallet St
- 8637 Greenwood Ln
- 8606 Hallet St
- 8639 Greenwood Ln
- 8613 Greenwood Ln
- 8535 Hallet St
- 8609 Greenwood Ln
- 8534 Hallet St
- 8536 Hallet St
- 8628 Greenwood Ln
Your Personal Tour Guide
Ask me questions while you tour the home.