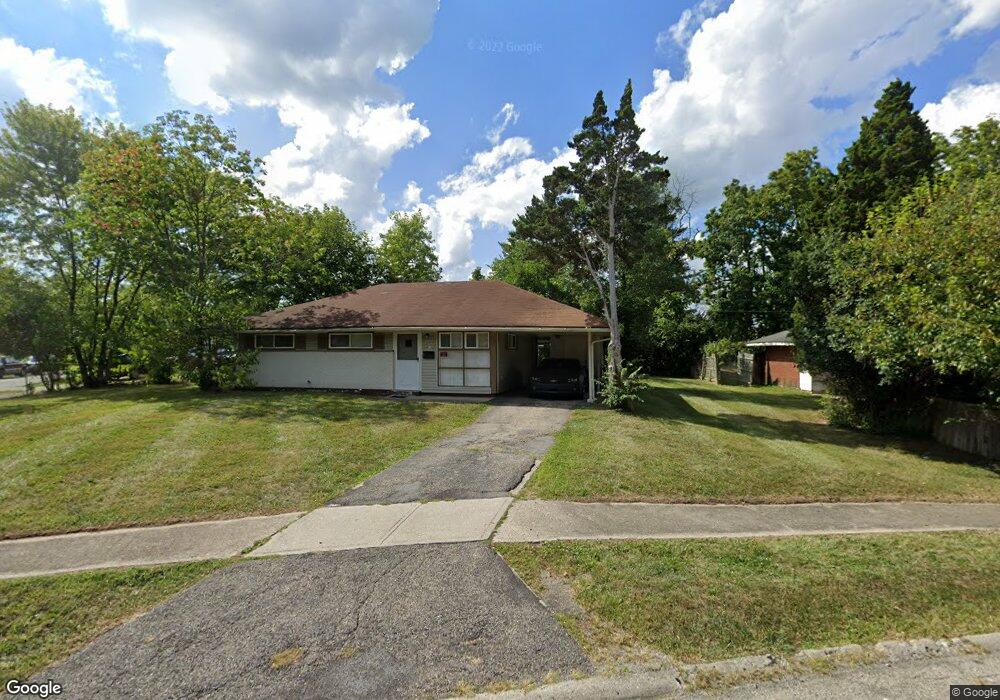
8615 Bobolink Dr Cincinnati, OH 45231
Finneytown NeighborhoodEstimated Value: $81,000 - $168,000
3
Beds
1
Bath
918
Sq Ft
$143/Sq Ft
Est. Value
About This Home
This home is located at 8615 Bobolink Dr, Cincinnati, OH 45231 and is currently estimated at $131,089, approximately $142 per square foot. 8615 Bobolink Dr is a home located in Hamilton County with nearby schools including Mt Healthy High School, St. Vivian School, and Central Baptist Academy.
Ownership History
Date
Name
Owned For
Owner Type
Purchase Details
Closed on
Jun 3, 2016
Sold by
Golden Real Estate
Bought by
Generation Two Properties Llc
Current Estimated Value
Purchase Details
Closed on
Jan 30, 2009
Sold by
Hammond Jeffrey K and Hammond Sherri
Bought by
Brittash Propeties Llc
Purchase Details
Closed on
Apr 8, 2004
Sold by
Us Bank Na
Bought by
Hammond Jeffrey K and Hammond Sherri
Purchase Details
Closed on
Mar 11, 2004
Sold by
Myrick Selina
Bought by
U S Bank Na and Morgan Stanley Dean Witter Capital 1 Inc
Purchase Details
Closed on
Sep 30, 1994
Sold by
Clark Orville and Clark Mary Joyce
Bought by
Myrick Selina
Home Financials for this Owner
Home Financials are based on the most recent Mortgage that was taken out on this home.
Original Mortgage
$51,943
Interest Rate
8.64%
Mortgage Type
FHA
Purchase Details
Closed on
Jun 23, 1994
Sold by
Stripling Loretta H and English Toundlaria
Bought by
Clark Orville and Nichols Glenn
Create a Home Valuation Report for This Property
The Home Valuation Report is an in-depth analysis detailing your home's value as well as a comparison with similar homes in the area
Home Values in the Area
Average Home Value in this Area
Purchase History
| Date | Buyer | Sale Price | Title Company |
|---|---|---|---|
| Generation Two Properties Llc | $42,500 | Chicago Title | |
| Brittash Propeties Llc | $38,500 | Fidelity Land Title Agency O | |
| Hammond Jeffrey K | $51,500 | Fidelity Land Title Agency | |
| U S Bank Na | $44,000 | -- | |
| Myrick Selina | -- | -- | |
| Clark Orville | $14,700 | -- |
Source: Public Records
Mortgage History
| Date | Status | Borrower | Loan Amount |
|---|---|---|---|
| Previous Owner | Myrick Selina | $51,943 |
Source: Public Records
Tax History Compared to Growth
Tax History
| Year | Tax Paid | Tax Assessment Tax Assessment Total Assessment is a certain percentage of the fair market value that is determined by local assessors to be the total taxable value of land and additions on the property. | Land | Improvement |
|---|---|---|---|---|
| 2024 | $1,800 | $29,355 | $5,439 | $23,916 |
| 2023 | $1,680 | $29,355 | $5,439 | $23,916 |
| 2022 | $1,111 | $13,941 | $5,383 | $8,558 |
| 2021 | $1,105 | $13,941 | $5,383 | $8,558 |
| 2020 | $1,092 | $13,941 | $5,383 | $8,558 |
| 2019 | $1,088 | $12,908 | $4,984 | $7,924 |
| 2018 | $1,093 | $12,908 | $4,984 | $7,924 |
| 2017 | $1,054 | $12,908 | $4,984 | $7,924 |
| 2016 | $1,075 | $12,804 | $5,387 | $7,417 |
| 2015 | $1,066 | $12,804 | $5,387 | $7,417 |
| 2014 | $1,059 | $12,804 | $5,387 | $7,417 |
| 2013 | $1,090 | $13,475 | $5,670 | $7,805 |
Source: Public Records
Map
Nearby Homes
- 8734 Grenada Dr
- 8681 Desoto Dr
- 1277 Prospect Place
- 8772 Balboa Dr
- 8840 Grenada Dr
- 8831 Daly Rd
- 1151 Hempstead Dr
- 8950 Daly Rd
- 8925 Monsanto Dr
- 8627 Mockingbird Ln
- 1478 Foxwood Dr
- 1464 Clovernoll Dr
- 1190 Sugartree Ct
- 8622 Mockingbird Ln
- 1458 Van Fleet Ave
- 1029 Bluejay Dr
- 1100 Gracewind Ct
- 1013 Vacationland Dr
- 1502 Clovernoll Dr
- 7929 Cherrywood Ct
- 8615 Bobolink Ave
- 8610 Desoto Dr
- 8621 Bobolink Ave
- 8616 Desoto Dr
- 8631 Bobolink Ave
- 8618 Bobolink Dr
- 8631 Bobolink Dr
- 8618 Bobolink Ave
- 8600 Bobolink Ave
- 1289 Landis Ln
- 1293 Landis Ln
- 8609 Desoto Dr
- 8622 Desoto Dr
- 8636 Bobolink Dr
- 8636 Bobolink Ave
- 8594 Bobolink Dr
- 8615 Desoto Dr
- 8594 Bobolink Ave
- 8651 Bobolink Ave
- 1285 Landis Ln