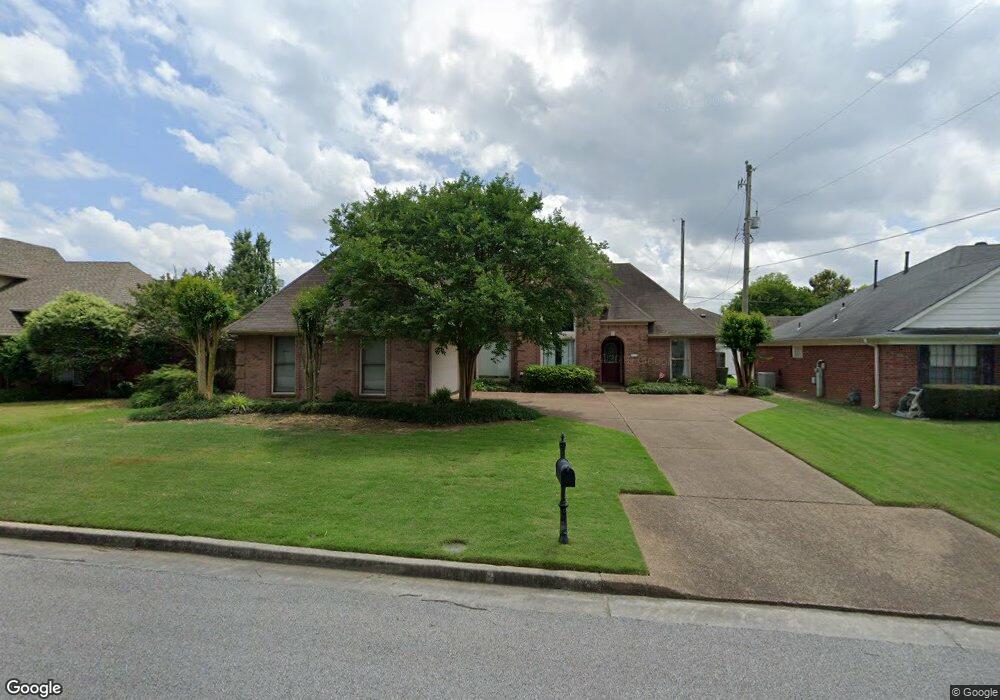
8615 Sunnyvale St N Cordova, TN 38018
Cordova NeighborhoodEstimated Value: $264,612 - $276,000
3
Beds
2
Baths
1,692
Sq Ft
$159/Sq Ft
Est. Value
About This Home
This home is located at 8615 Sunnyvale St N, Cordova, TN 38018 and is currently estimated at $269,153, approximately $159 per square foot. 8615 Sunnyvale St N is a home located in Shelby County with nearby schools including Cordova Elementary School, Cordova Middle School, and Cordova High School.
Ownership History
Date
Name
Owned For
Owner Type
Purchase Details
Closed on
Mar 4, 2009
Sold by
Hinesley Charles A
Bought by
Hinesley Amanda Walpole
Current Estimated Value
Purchase Details
Closed on
Jul 20, 2001
Sold by
Bass Brian N
Bought by
Hinesley Charles A and Hinesley Amanda L
Home Financials for this Owner
Home Financials are based on the most recent Mortgage that was taken out on this home.
Original Mortgage
$128,250
Outstanding Balance
$48,066
Interest Rate
7.08%
Estimated Equity
$221,087
Purchase Details
Closed on
Nov 26, 1997
Sold by
Lux Peggy S and Hopkins Peggy Sue
Bought by
Bass Brian N
Home Financials for this Owner
Home Financials are based on the most recent Mortgage that was taken out on this home.
Original Mortgage
$131,135
Interest Rate
7.38%
Mortgage Type
FHA
Purchase Details
Closed on
Nov 1, 1997
Sold by
Mendez Jose Luis Herta
Bought by
Hopkins Peggy Sue
Home Financials for this Owner
Home Financials are based on the most recent Mortgage that was taken out on this home.
Original Mortgage
$131,135
Interest Rate
7.38%
Mortgage Type
FHA
Create a Home Valuation Report for This Property
The Home Valuation Report is an in-depth analysis detailing your home's value as well as a comparison with similar homes in the area
Home Values in the Area
Average Home Value in this Area
Purchase History
| Date | Buyer | Sale Price | Title Company |
|---|---|---|---|
| Hinesley Amanda Walpole | -- | None Available | |
| Hinesley Charles A | $135,000 | -- | |
| Hinesley Charles A | $135,000 | -- | |
| Bass Brian N | $131,900 | Chicago Title Insurance Co | |
| Bass Brian N | $131,900 | Chicago Title Insurance Co | |
| Hopkins Peggy Sue | -- | -- | |
| Hopkins Peggy Sue | -- | -- |
Source: Public Records
Mortgage History
| Date | Status | Borrower | Loan Amount |
|---|---|---|---|
| Open | Hinesley Charles A | $128,250 | |
| Closed | Hinesley Charles A | $128,250 | |
| Previous Owner | Bass Brian N | $131,135 |
Source: Public Records
Tax History Compared to Growth
Tax History
| Year | Tax Paid | Tax Assessment Tax Assessment Total Assessment is a certain percentage of the fair market value that is determined by local assessors to be the total taxable value of land and additions on the property. | Land | Improvement |
|---|---|---|---|---|
| 2025 | $1,598 | $66,500 | $14,750 | $51,750 |
| 2024 | $1,598 | $47,125 | $8,500 | $38,625 |
| 2023 | $2,871 | $47,125 | $8,500 | $38,625 |
| 2022 | $2,871 | $47,125 | $8,500 | $38,625 |
| 2021 | $2,904 | $47,125 | $8,500 | $38,625 |
| 2020 | $2,589 | $35,725 | $8,500 | $27,225 |
| 2019 | $2,589 | $35,725 | $8,500 | $27,225 |
| 2018 | $2,589 | $35,725 | $8,500 | $27,225 |
| 2017 | $1,468 | $35,725 | $8,500 | $27,225 |
| 2016 | $1,351 | $30,925 | $0 | $0 |
| 2014 | $1,351 | $30,925 | $0 | $0 |
Source: Public Records
Map
Nearby Homes
- 8643 Timber Creek Dr
- 8664 Eagle View Dr
- 857 Paradise Dr
- 8532 Shingle Oaks Dr
- 8659 Colleton Way
- 8663 Colleton Way
- 8667 Colleton Way
- 8671 Colleton Way
- 8675 Colleton Way
- 8524 Shady Elm Dr
- 8727 Thor Rd
- 8502 Griffin Park Dr
- 747 Overcup Oaks Cove
- 970 Bending Pine Ln
- 1025 Belfiore Ln
- 1024 Duomo Cove
- 8301 Weatherwood Ln
- 884 Camden Grove Cove
- 470 Walnut Point Cove
- 0 Chelsea Meadow Lot 40 Cove Unit 10005859
- 8607 Sunnyvale St N
- 8627 Sunnyvale St S
- 8619 Sunnyvale St N
- 764 Radiance Dr
- 8616 Sunnyvale St S
- 786 Radiance Dr
- 8624 Sunnyvale St S
- 754 Radiance Dr
- 8627 Sunnyvale St N
- 8595 Sunnyvale St S
- 796 Radiance Dr
- 8634 Sunnyvale St S
- 8633 Sunnyvale St S
- 8596 Sunnyvale St S
- 763 N Ericson Rd
- 759 N Ericson Rd
- 763 Radiance Dr
- 744 Radiance Dr
- 804 Radiance Dr
- 767 N Ericson Rd