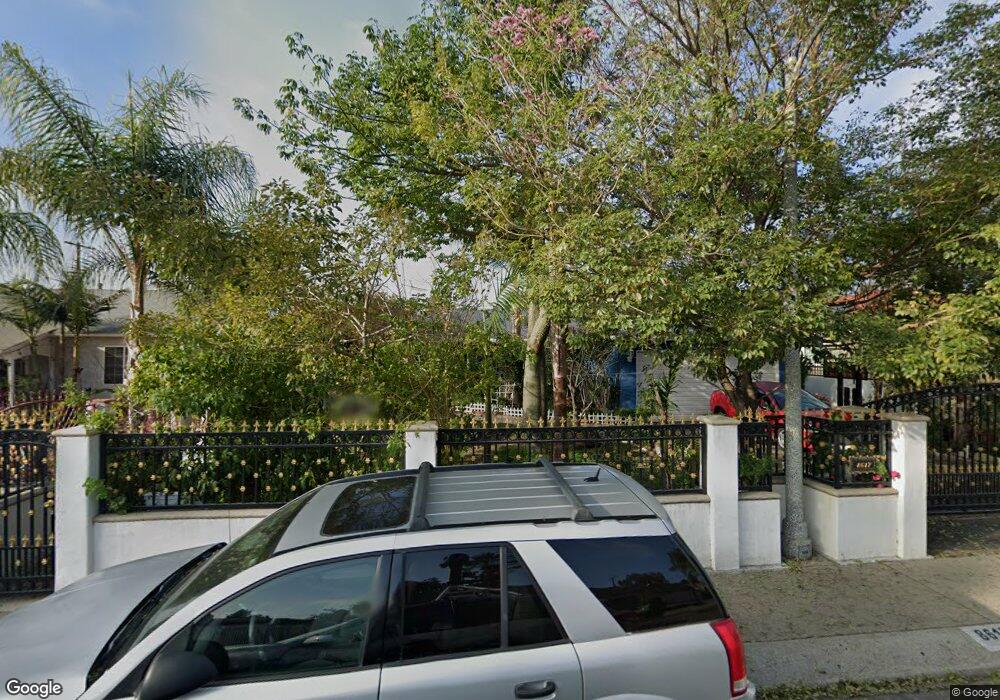
8617 Stansbury Ave Panorama City, CA 91402
Estimated Value: $702,085 - $767,000
3
Beds
1
Bath
1,014
Sq Ft
$723/Sq Ft
Est. Value
About This Home
This home is located at 8617 Stansbury Ave, Panorama City, CA 91402 and is currently estimated at $732,771, approximately $722 per square foot. 8617 Stansbury Ave is a home located in Los Angeles County with nearby schools including Chase Street Elementary School, Vista Middle School, and James Monroe High School.
Ownership History
Date
Name
Owned For
Owner Type
Purchase Details
Closed on
Mar 20, 2017
Sold by
Samrejklj Phasinee
Bought by
Phasinee Samrejkij & Floyd Farr Living T
Current Estimated Value
Purchase Details
Closed on
Jul 27, 2011
Sold by
Fusion Power Products Inc
Bought by
Samrejkij Phasinee and Farr Floyd
Home Financials for this Owner
Home Financials are based on the most recent Mortgage that was taken out on this home.
Original Mortgage
$223,200
Interest Rate
4.37%
Mortgage Type
New Conventional
Purchase Details
Closed on
Mar 25, 2011
Sold by
Hirsch Nina and The Taubkin Trust
Bought by
Fusion Power Products Inc
Purchase Details
Closed on
Oct 7, 2010
Sold by
Taubkin Marilyn J
Bought by
Taubkin Marilyn J and Marilyn Taubkin Living Trust
Create a Home Valuation Report for This Property
The Home Valuation Report is an in-depth analysis detailing your home's value as well as a comparison with similar homes in the area
Home Values in the Area
Average Home Value in this Area
Purchase History
| Date | Buyer | Sale Price | Title Company |
|---|---|---|---|
| Phasinee Samrejkij & Floyd Farr Living T | -- | None Available | |
| Samrejkij Phasinee | $248,000 | Equity Title | |
| Fusion Power Products Inc | $190,000 | None Available | |
| Taubkin Marilyn J | -- | None Available | |
| Taubkin Marilyn J | -- | None Available |
Source: Public Records
Mortgage History
| Date | Status | Borrower | Loan Amount |
|---|---|---|---|
| Previous Owner | Samrejkij Phasinee | $223,200 |
Source: Public Records
Tax History Compared to Growth
Tax History
| Year | Tax Paid | Tax Assessment Tax Assessment Total Assessment is a certain percentage of the fair market value that is determined by local assessors to be the total taxable value of land and additions on the property. | Land | Improvement |
|---|---|---|---|---|
| 2025 | $3,942 | $311,488 | $184,634 | $126,854 |
| 2024 | $3,942 | $305,381 | $181,014 | $124,367 |
| 2023 | $3,869 | $299,394 | $177,465 | $121,929 |
| 2022 | $3,694 | $293,525 | $173,986 | $119,539 |
| 2021 | $3,647 | $287,771 | $170,575 | $117,196 |
| 2019 | $3,541 | $279,237 | $165,516 | $113,721 |
| 2018 | $3,480 | $273,763 | $162,271 | $111,492 |
| 2016 | $3,323 | $263,134 | $155,971 | $107,163 |
| 2015 | $3,276 | $259,183 | $153,629 | $105,554 |
| 2014 | $3,295 | $254,107 | $150,620 | $103,487 |
Source: Public Records
Map
Nearby Homes
- 8644 Katherine Ave
- 8827 -8829 Sylmar Ave
- 8748 Sylmar Ave
- 8360 Katherine Ave Unit 1
- 8406 Lennox Ave
- 8651 Ranchito Ave
- 8600 Colbath Ave
- 8900 Hazeltine Ave
- 8649 Cantaloupe Ave
- 8831 Tyrone Ave
- 14324 Roscoe Blvd
- 14320 Osborne St
- 14054 Roscoe Blvd
- 8515 Mammoth Ave
- 9044 Sylmar Ave
- 8730 Cedros Ave Unit C
- 8105 Katherine Ave
- 8800 Cedros Ave Unit 209
- 8800 Cedros Ave Unit 204
- 8800 Cedros Ave Unit 219
- 8611 Stansbury Ave
- 8623 Stansbury Ave
- 8606 Sylmar Ave
- 8612 Sylmar Ave
- 8600 Sylmar Ave
- 8629 Stansbury Ave
- 8618 Sylmar Ave
- 8618 Stansbury Ave
- 8540 Sylmar Ave
- 8612 Stansbury Ave
- 8624 Stansbury Ave
- 8601 Stansbury Ave
- 8635 Stansbury Ave
- 8606 Stansbury Ave Unit 209
- 8606 Stansbury Ave
- 8628 Stansbury Ave
- 8624 Sylmar Ave
- 8534 Sylmar Ave
- 8600 Stansbury Ave
- 8634 Stansbury Ave