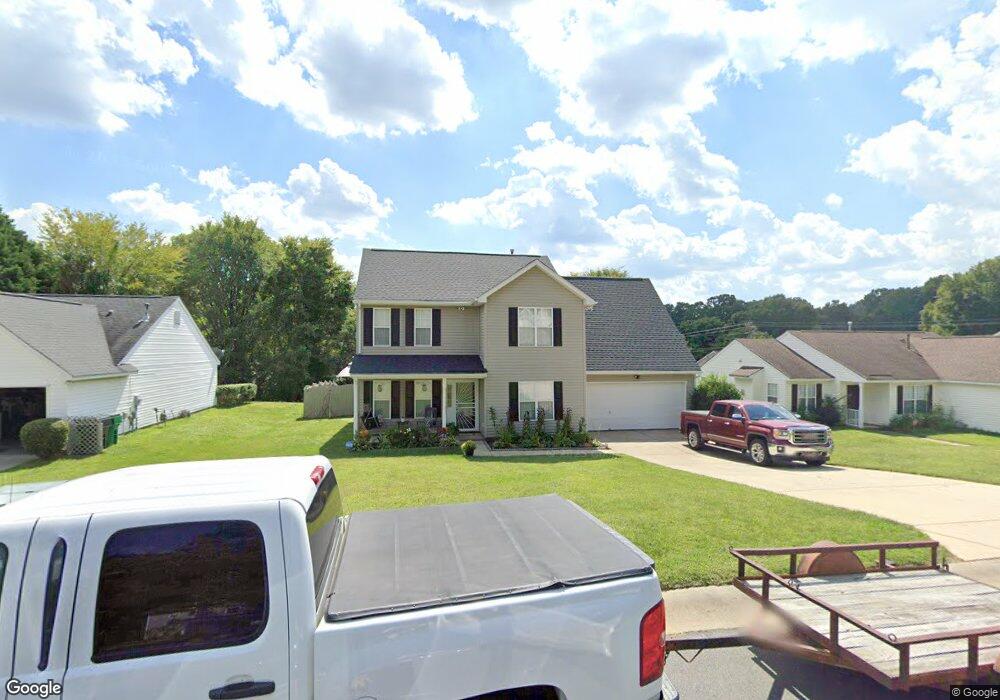
8618 Terra Cotta Dr Charlotte, NC 28215
Silverwood NeighborhoodEstimated Value: $339,000 - $381,000
3
Beds
3
Baths
1,798
Sq Ft
$198/Sq Ft
Est. Value
About This Home
This home is located at 8618 Terra Cotta Dr, Charlotte, NC 28215 and is currently estimated at $356,350, approximately $198 per square foot. 8618 Terra Cotta Dr is a home located in Mecklenburg County with nearby schools including Northridge Middle School, Rocky River High School, and Hickory Grove Christian School.
Ownership History
Date
Name
Owned For
Owner Type
Purchase Details
Closed on
Aug 15, 2017
Sold by
Deeg Deborah J and Bethay Deborah
Bought by
Deeg Deborah J
Current Estimated Value
Purchase Details
Closed on
Nov 28, 2012
Sold by
Secretary Of Hud
Bought by
Bethany Deborah
Home Financials for this Owner
Home Financials are based on the most recent Mortgage that was taken out on this home.
Original Mortgage
$56,293
Outstanding Balance
$39,057
Interest Rate
3.4%
Mortgage Type
FHA
Estimated Equity
$317,293
Purchase Details
Closed on
Apr 26, 2012
Sold by
Diego Alexander and Diego Linda
Bought by
Secretary Of Housing & Urban Development
Purchase Details
Closed on
Feb 4, 1999
Sold by
Inc Galloway Don Homes Of North Carolin
Bought by
Diego Alexander and Diego Linda
Home Financials for this Owner
Home Financials are based on the most recent Mortgage that was taken out on this home.
Original Mortgage
$139,650
Interest Rate
6.8%
Mortgage Type
VA
Create a Home Valuation Report for This Property
The Home Valuation Report is an in-depth analysis detailing your home's value as well as a comparison with similar homes in the area
Home Values in the Area
Average Home Value in this Area
Purchase History
| Date | Buyer | Sale Price | Title Company |
|---|---|---|---|
| Deeg Deborah J | -- | None Available | |
| Bethany Deborah | -- | None Available | |
| Secretary Of Housing & Urban Development | $186,307 | None Available | |
| Diego Alexander | $137,000 | -- |
Source: Public Records
Mortgage History
| Date | Status | Borrower | Loan Amount |
|---|---|---|---|
| Open | Bethany Deborah | $56,293 | |
| Previous Owner | Diego Alexander | $139,650 |
Source: Public Records
Tax History Compared to Growth
Tax History
| Year | Tax Paid | Tax Assessment Tax Assessment Total Assessment is a certain percentage of the fair market value that is determined by local assessors to be the total taxable value of land and additions on the property. | Land | Improvement |
|---|---|---|---|---|
| 2025 | $2,805 | $350,100 | $75,000 | $275,100 |
| 2024 | $2,805 | $350,100 | $75,000 | $275,100 |
| 2023 | $2,707 | $350,100 | $75,000 | $275,100 |
| 2022 | $1,929 | $186,900 | $35,000 | $151,900 |
| 2021 | $1,918 | $186,900 | $35,000 | $151,900 |
| 2020 | $1,911 | $186,900 | $35,000 | $151,900 |
| 2019 | $1,895 | $186,900 | $35,000 | $151,900 |
| 2018 | $1,811 | $132,400 | $23,800 | $108,600 |
| 2017 | $1,777 | $132,400 | $23,800 | $108,600 |
| 2016 | $1,767 | $132,400 | $23,800 | $108,600 |
| 2015 | $1,756 | $132,400 | $23,800 | $108,600 |
| 2014 | -- | $128,500 | $23,800 | $104,700 |
Source: Public Records
Map
Nearby Homes
- 8122 Cadmium Ct
- 8123 Vermilion Dr
- 8120 Vermilion Dr
- 6027 Veld Ct
- 8619 Frank Grier Rd
- Wilmington Plan at Grier Meadows
- Ellerbe Plan at Grier Meadows
- Cypress Plan at Grier Meadows
- Davidson Plan at Grier Meadows
- 8615 Frank Grier Rd
- Raleigh Plan at Grier Meadows
- 8611 Frank Grier Rd
- 2737 Red Squirrel Trail
- 8131 Strawberry Point Dr
- 2703 Bramble Ridge Ct Unit 37
- 7308 Rothmore St
- 7601 Plott Rd
- 8508 Highgate Dr
- 7208 Applecross Ln
- 7144 Chapparall Ln
- 8622 Terra Cotta Dr
- 8614 Terra Cotta Dr
- 8633 Moody Rd
- 8604 Terra Cotta Dr
- 8626 Terra Cotta Dr
- 8625 Terra Cotta Dr
- 8630 Terra Cotta Dr
- 8621 Terra Cotta Dr
- 8607 Terra Cotta Dr Unit 2
- 8607 Terra Cotta Dr
- 8711 Moody Rd
- 8629 Terra Cotta Dr
- 8612 Moody Rd
- 8608 Moody Rd
- 8603 Terra Cotta Dr
- 8618 Moody Rd
- 8211 Cadmium Ct
- 8214 Cadmium Ct
- 8518 Terra Cotta Dr
- 8634 Terra Cotta Dr