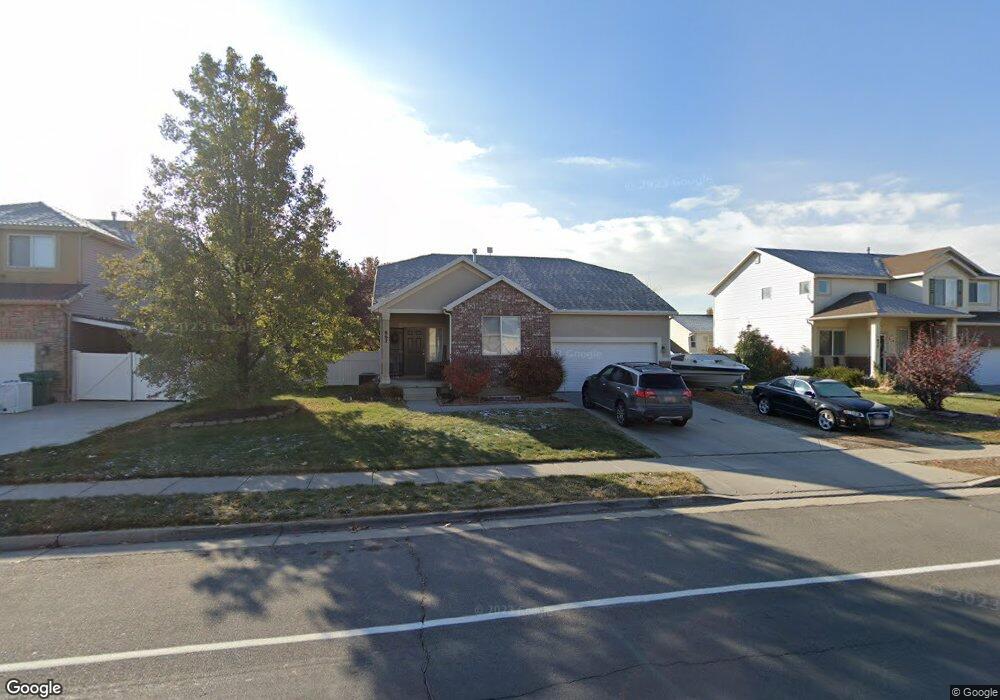
862 E 2200 S Clearfield, UT 84015
Estimated Value: $529,000 - $563,000
6
Beds
3
Baths
2,632
Sq Ft
$207/Sq Ft
Est. Value
About This Home
This home is located at 862 E 2200 S, Clearfield, UT 84015 and is currently estimated at $545,229, approximately $207 per square foot. 862 E 2200 S is a home located in Davis County with nearby schools including Antelope Elementary School, North Davis Junior High School, and Clearfield High School.
Ownership History
Date
Name
Owned For
Owner Type
Purchase Details
Closed on
Oct 26, 2021
Sold by
Sunder Sham
Bought by
Hill Alan
Current Estimated Value
Home Financials for this Owner
Home Financials are based on the most recent Mortgage that was taken out on this home.
Original Mortgage
$400,000
Outstanding Balance
$364,763
Interest Rate
2.8%
Mortgage Type
New Conventional
Estimated Equity
$180,466
Purchase Details
Closed on
Jun 26, 2008
Sold by
Sutton John H and Sutton Phyllis A
Bought by
Sunder Sham
Home Financials for this Owner
Home Financials are based on the most recent Mortgage that was taken out on this home.
Original Mortgage
$248,106
Interest Rate
5.99%
Mortgage Type
FHA
Purchase Details
Closed on
May 6, 2003
Sold by
Richmond American Homes Of Utah Inc
Bought by
Sutton John H and Sutton Phyllis A
Home Financials for this Owner
Home Financials are based on the most recent Mortgage that was taken out on this home.
Original Mortgage
$122,400
Interest Rate
6.68%
Create a Home Valuation Report for This Property
The Home Valuation Report is an in-depth analysis detailing your home's value as well as a comparison with similar homes in the area
Home Values in the Area
Average Home Value in this Area
Purchase History
| Date | Buyer | Sale Price | Title Company |
|---|---|---|---|
| Hill Alan | -- | Legendstitle Llc | |
| Sunder Sham | -- | Metro National Title | |
| Sutton John H | -- | First American Title Co |
Source: Public Records
Mortgage History
| Date | Status | Borrower | Loan Amount |
|---|---|---|---|
| Open | Hill Alan | $400,000 | |
| Previous Owner | Sunder Sham | $248,106 | |
| Previous Owner | Sutton John H | $122,400 | |
| Closed | Sutton John H | $30,600 |
Source: Public Records
Tax History
| Year | Tax Paid | Tax Assessment Tax Assessment Total Assessment is a certain percentage of the fair market value that is determined by local assessors to be the total taxable value of land and additions on the property. | Land | Improvement |
|---|---|---|---|---|
| 2025 | $2,964 | $265,650 | $72,093 | $193,557 |
| 2024 | $2,870 | $259,050 | $68,925 | $190,125 |
| 2023 | $2,644 | $438,000 | $110,323 | $327,677 |
| 2022 | $2,897 | $259,600 | $63,209 | $196,391 |
| 2021 | $2,748 | $372,000 | $67,057 | $304,943 |
| 2020 | $2,387 | $321,000 | $56,367 | $264,633 |
| 2019 | $2,313 | $307,000 | $59,172 | $247,828 |
| 2018 | $2,158 | $279,000 | $52,521 | $226,479 |
| 2016 | $1,894 | $128,040 | $20,970 | $107,070 |
| 2015 | $1,848 | $119,130 | $20,970 | $98,160 |
| 2014 | $1,785 | $116,611 | $20,970 | $95,641 |
| 2013 | -- | $90,645 | $29,480 | $61,165 |
Source: Public Records
Map
Nearby Homes
- 1477 N 2375 W
- 1430 N 2100 W
- 1491 N 1875 W
- 1491 N 1875 W Unit 158
- 1487 N 1875 W
- 1487 N 1875 W Unit 159
- 1483 N 1875 W
- 1479 N 1875 W
- 1479 N 1875 W Unit 161
- 1475 N 1875 W
- 1471 N 1875 W
- 1471 N 1875 W Unit 163
- 1463 N 1875 W Unit 165
- 1459 N 1875 W Unit 166
- 1452 N 1875 W Unit 146
- 1451 N 1875 W Unit 168
- 668 E 2000 S
- 1141 N 2275 W
- 1740 N Gregory Dr
- 1896 Cliff Place
Your Personal Tour Guide
Ask me questions while you tour the home.