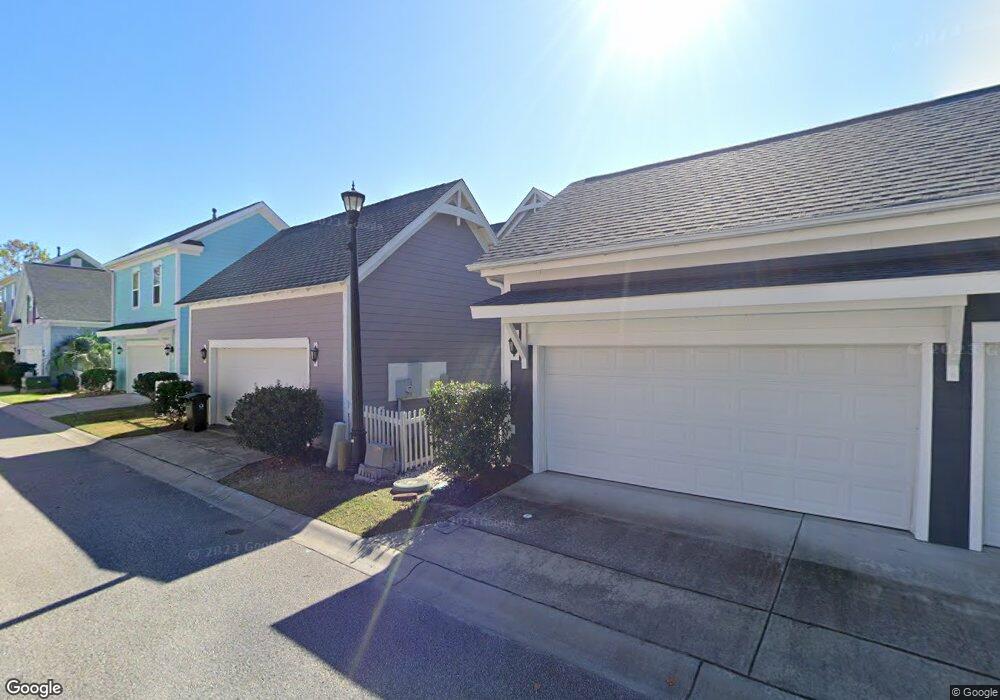
862 Pancho St Unit Hampton II Myrtle Beach, SC 29577
Market Commons NeighborhoodEstimated Value: $543,206 - $652,000
3
Beds
4
Baths
2,235
Sq Ft
$266/Sq Ft
Est. Value
About This Home
This home is located at 862 Pancho St Unit Hampton II, Myrtle Beach, SC 29577 and is currently estimated at $594,302, approximately $265 per square foot. 862 Pancho St Unit Hampton II is a home located in Horry County with nearby schools including Myrtle Beach Child Development Center, Myrtle Beach Primary School, and Myrtle Beach Elementary School.
Ownership History
Date
Name
Owned For
Owner Type
Purchase Details
Closed on
Mar 22, 2021
Sold by
Baughman Samuel D
Bought by
Gale Robert A
Current Estimated Value
Home Financials for this Owner
Home Financials are based on the most recent Mortgage that was taken out on this home.
Original Mortgage
$285,000
Outstanding Balance
$234,004
Interest Rate
2.8%
Mortgage Type
New Conventional
Estimated Equity
$360,298
Purchase Details
Closed on
Aug 7, 2018
Sold by
Boulanger William Francis
Bought by
Baughman Samuel D
Purchase Details
Closed on
Sep 3, 2014
Sold by
Dockstreet At The Market Common Inc
Bought by
Fanini Frederick J and Campbell Trudy B
Purchase Details
Closed on
Dec 12, 2013
Sold by
Luk Mb2 Llc
Bought by
Docktreet At The Market Common Inc
Home Financials for this Owner
Home Financials are based on the most recent Mortgage that was taken out on this home.
Original Mortgage
$197,423
Interest Rate
4.25%
Mortgage Type
Construction
Create a Home Valuation Report for This Property
The Home Valuation Report is an in-depth analysis detailing your home's value as well as a comparison with similar homes in the area
Home Values in the Area
Average Home Value in this Area
Purchase History
| Date | Buyer | Sale Price | Title Company |
|---|---|---|---|
| Gale Robert A | $385,000 | -- | |
| Baughman Samuel D | $347,000 | -- | |
| Fanini Frederick J | $292,169 | -- | |
| Docktreet At The Market Common Inc | $140,000 | -- |
Source: Public Records
Mortgage History
| Date | Status | Borrower | Loan Amount |
|---|---|---|---|
| Open | Gale Robert A | $285,000 | |
| Previous Owner | Docktreet At The Market Common Inc | $197,423 |
Source: Public Records
Tax History Compared to Growth
Tax History
| Year | Tax Paid | Tax Assessment Tax Assessment Total Assessment is a certain percentage of the fair market value that is determined by local assessors to be the total taxable value of land and additions on the property. | Land | Improvement |
|---|---|---|---|---|
| 2024 | $7,063 | $18,490 | $5,054 | $13,436 |
| 2023 | $7,063 | $13,775 | $3,947 | $9,828 |
| 2021 | $1,562 | $13,775 | $3,947 | $9,828 |
| 2020 | $1,097 | $13,775 | $3,947 | $9,828 |
| 2019 | $1,056 | $13,775 | $3,947 | $9,828 |
| 2018 | $944 | $12,006 | $2,702 | $9,304 |
| 2017 | $0 | $12,006 | $2,702 | $9,304 |
| 2016 | -- | $12,006 | $2,702 | $9,304 |
| 2015 | $4,683 | $12,006 | $2,702 | $9,304 |
| 2014 | $607 | $2,400 | $2,400 | $0 |
Source: Public Records
Map
Nearby Homes
- 861 Murray Ave
- 830 Howard Ave Unit D
- 750 Howard Ave Unit D
- 750 Howard Ave Unit E
- 1411 Peterson St
- 2790 Howard Ave Unit D
- 736 Satterwhite Way
- 524 Farrow Pkwy
- 3429 Thrash Way
- 804 Shine Ave
- 750 Shine Ave Unit 750
- 853 Johnson Ave
- 3452 Baldwin Ln
- 962 Hendrick Ave
- 800 Curtis Brown Ln
- 763 Moen Place Unit 763-B
- 852 Iris St Unit D
- 3506 Evergreen Way
- 945 Rosencrans Ln Unit B
- 780 Gabreski Ln Unit A-2
- 862 Pancho St
- 862 Pancho St Unit Hampton II
- 866 Pancho St Unit Dorchester Model
- 858 Pancho St
- 854 Pancho St Unit The Lexington
- 854 Pancho St
- 854 Pancho St Unit Lot 29 R10 N. Verd
- 51 Hendrick Ave
- 2613 Kruzel St Unit York
- 2609 Kruzel St Unit The Olivia
- 2609 Kruzel St
- 2609 Kruzel St Unit The Olivia
- 850 Pancho St
- 775 Johnson Ave Unit The Olivia
- 775 Johnson Ave Unit Olivia
- 775 Johnson Ave
- 867 Murray Ave
- 847 Murray Ave
- 841 Murray Ave Unit Drayton 14
- 841 Murray Ave