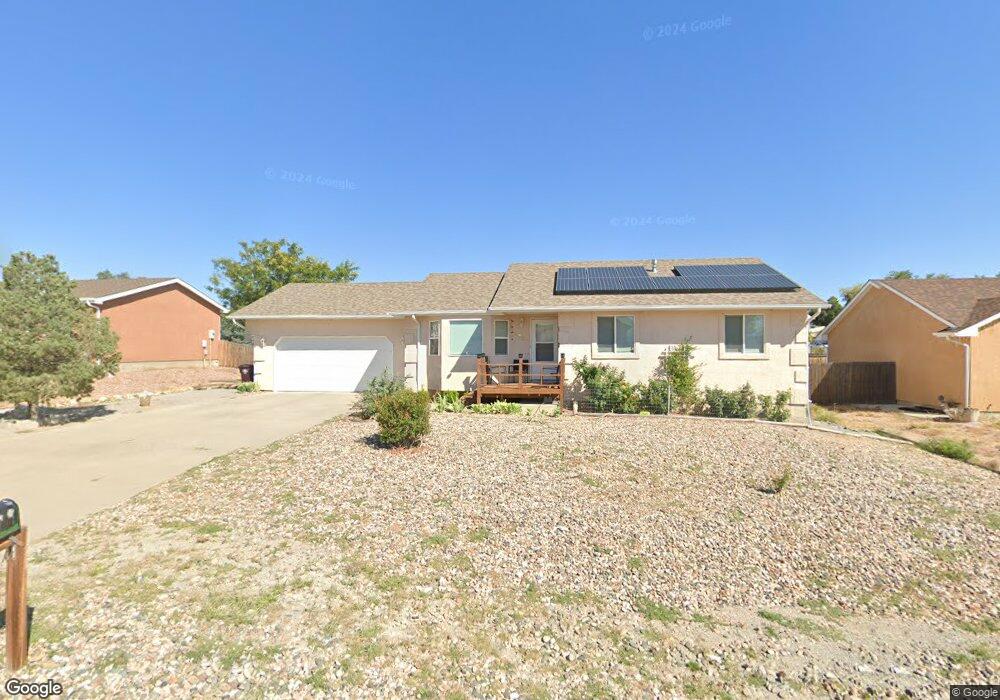
862 S Blakeland Dr Pueblo, CO 81007
Estimated Value: $355,000 - $372,000
3
Beds
2
Baths
1,288
Sq Ft
$282/Sq Ft
Est. Value
About This Home
This home is located at 862 S Blakeland Dr, Pueblo, CO 81007 and is currently estimated at $363,668, approximately $282 per square foot. 862 S Blakeland Dr is a home located in Pueblo County with nearby schools including Desert Sage Elementary School, Liberty Point International School, and Pueblo West High School.
Ownership History
Date
Name
Owned For
Owner Type
Purchase Details
Closed on
Feb 23, 2020
Sold by
Shuwarger Lee
Bought by
Shuwarger Lee and Shuwarger Jessica Espinosa
Current Estimated Value
Purchase Details
Closed on
Aug 9, 2019
Sold by
Vigil Joe C and Vigil Debra L
Bought by
Shuwarger Lee
Home Financials for this Owner
Home Financials are based on the most recent Mortgage that was taken out on this home.
Original Mortgage
$213,675
Outstanding Balance
$138,975
Interest Rate
3.16%
Mortgage Type
FHA
Estimated Equity
$224,693
Purchase Details
Closed on
Oct 27, 2002
Sold by
Khilla Adil A
Bought by
Vigil Joe C + Debra L
Purchase Details
Closed on
Apr 17, 1996
Sold by
Wadle Glen L + Kathryn A
Bought by
Khilla Adil A
Purchase Details
Closed on
Jun 29, 1976
Sold by
Lawyers Title Of Pueblo
Bought by
Wadle Glen L + Kathryn A
Create a Home Valuation Report for This Property
The Home Valuation Report is an in-depth analysis detailing your home's value as well as a comparison with similar homes in the area
Home Values in the Area
Average Home Value in this Area
Purchase History
| Date | Buyer | Sale Price | Title Company |
|---|---|---|---|
| Shuwarger Lee | -- | None Available | |
| Shuwarger Lee | $240,000 | Land Title Guarantee Co | |
| Vigil Joe C + Debra L | $8,500 | -- | |
| Khilla Adil A | $3,500 | -- | |
| Wadle Glen L + Kathryn A | -- | -- |
Source: Public Records
Mortgage History
| Date | Status | Borrower | Loan Amount |
|---|---|---|---|
| Open | Shuwarger Lee | $213,675 |
Source: Public Records
Tax History Compared to Growth
Tax History
| Year | Tax Paid | Tax Assessment Tax Assessment Total Assessment is a certain percentage of the fair market value that is determined by local assessors to be the total taxable value of land and additions on the property. | Land | Improvement |
|---|---|---|---|---|
| 2024 | $2,241 | $22,330 | -- | -- |
| 2023 | $2,267 | $26,020 | $2,010 | $24,010 |
| 2022 | $1,760 | $17,540 | $2,090 | $15,450 |
| 2021 | $1,805 | $18,050 | $2,150 | $15,900 |
| 2020 | $1,397 | $18,050 | $2,150 | $15,900 |
| 2019 | $1,393 | $13,939 | $501 | $13,438 |
| 2018 | $1,267 | $12,668 | $504 | $12,164 |
| 2017 | $1,268 | $12,668 | $504 | $12,164 |
| 2016 | $1,161 | $11,617 | $716 | $10,901 |
| 2015 | $1,151 | $11,617 | $716 | $10,901 |
| 2014 | $1,041 | $10,497 | $796 | $9,701 |
Source: Public Records
Map
Nearby Homes
- 853 S Blakeland Dr
- 855 S Mccoy Dr
- 782 S Mccoy Dr
- 921 S Cellini Ln
- 765 S Sterling Dr
- 63 E Vern Dr
- 880 S Dante Dr
- 817 S Aguilar Ln
- 108 E Kipling Dr
- 800 S Dogwood Ct
- 715 S Joe Martinez Ln
- 113 E Homer Dr
- 128 E Byrd Dr
- 88 E Hemlock Dr
- 664 S Dante Dr
- 714 S Walton Dr
- 629 S Aguilar Dr
- 129 E Countryside Dr
- 914 S Greenway Ave
- 181 E Kipling Dr
- 870 S Blakeland Dr
- 870 S Blakeland Dr Unit 23
- 856 S Blakeland Dr
- 856 S Blakeland Dr Unit 25
- 815 S Mccoy Dr
- 815 S Mccoy Dr Unit 11
- 807 S Mccoy Dr
- 823 S Mccoy Dr
- 876 S Blakeland Dr
- 850 S Blakeland Dr
- 850 S Blakeland Dr Unit 26
- 829 S Mccoy Dr
- 861 S Blakeland Dr
- 861 S Blakeland Dr Unit 12
- 869 S Blakeland Dr
- 882 S Blakeland Dr
- 793 S Mccoy Dr
- 844 S Blakeland Dr
- 837 S Mccoy Dr
- 837 S Mccoy Dr Unit *14*