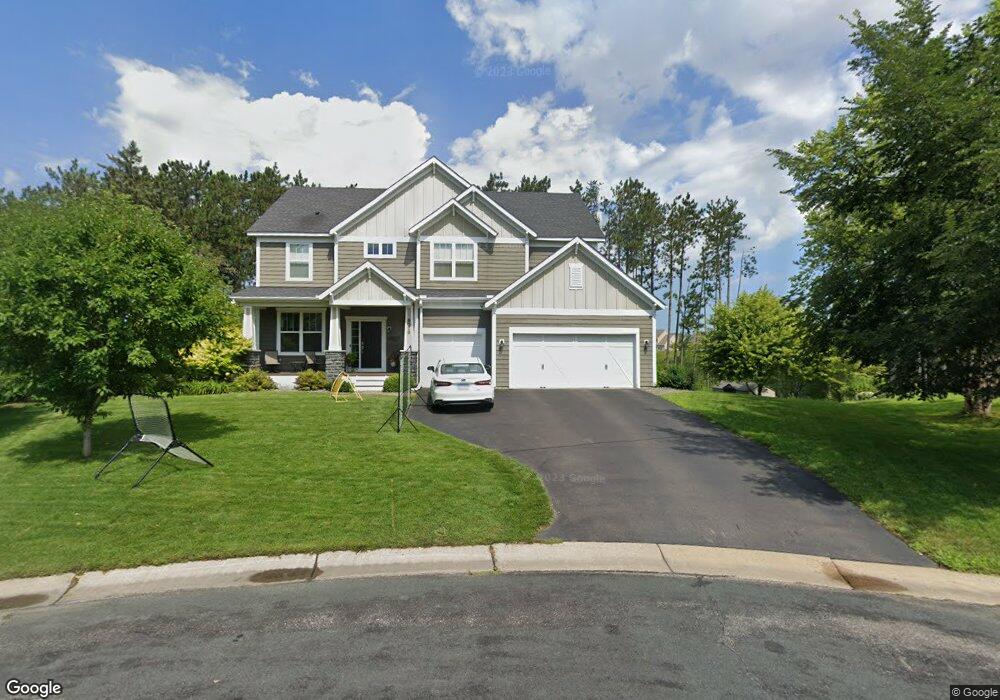
8620 Crimson Way Inver Grove Heights, MN 55076
Estimated Value: $663,000 - $686,411
4
Beds
3
Baths
3,074
Sq Ft
$219/Sq Ft
Est. Value
About This Home
This home is located at 8620 Crimson Way, Inver Grove Heights, MN 55076 and is currently estimated at $674,103, approximately $219 per square foot. 8620 Crimson Way is a home located in Dakota County with nearby schools including Pine Bend Elementary School, Inver Grove Heights Middle School, and Simley Senior High School.
Ownership History
Date
Name
Owned For
Owner Type
Purchase Details
Closed on
Nov 17, 2023
Sold by
Byriel Joseph and Byriel Erin
Bought by
Knopik William
Current Estimated Value
Home Financials for this Owner
Home Financials are based on the most recent Mortgage that was taken out on this home.
Original Mortgage
$479,200
Outstanding Balance
$470,825
Interest Rate
7.49%
Mortgage Type
New Conventional
Estimated Equity
$203,278
Purchase Details
Closed on
May 2, 2014
Sold by
Pulte Homes Of Minnesota Llc
Bought by
Byriel Joseph and Byriel Erin
Home Financials for this Owner
Home Financials are based on the most recent Mortgage that was taken out on this home.
Original Mortgage
$44,700
Interest Rate
4.33%
Mortgage Type
Credit Line Revolving
Purchase Details
Closed on
Sep 21, 2011
Sold by
Igh Development Llc
Bought by
Wells Fargo Bank National Association
Create a Home Valuation Report for This Property
The Home Valuation Report is an in-depth analysis detailing your home's value as well as a comparison with similar homes in the area
Home Values in the Area
Average Home Value in this Area
Purchase History
| Date | Buyer | Sale Price | Title Company |
|---|---|---|---|
| Knopik William | $599,000 | -- | |
| Byriel Joseph | $499,845 | Pgp Title Inc | |
| Wells Fargo Bank National Association | -- | None Available |
Source: Public Records
Mortgage History
| Date | Status | Borrower | Loan Amount |
|---|---|---|---|
| Open | Knopik William | $479,200 | |
| Previous Owner | Byriel Joseph | $44,700 |
Source: Public Records
Tax History Compared to Growth
Tax History
| Year | Tax Paid | Tax Assessment Tax Assessment Total Assessment is a certain percentage of the fair market value that is determined by local assessors to be the total taxable value of land and additions on the property. | Land | Improvement |
|---|---|---|---|---|
| 2024 | $6,564 | $648,500 | $183,500 | $465,000 |
| 2023 | $6,564 | $610,700 | $178,900 | $431,800 |
| 2022 | $6,442 | $609,400 | $188,100 | $421,300 |
| 2021 | $6,074 | $563,600 | $163,600 | $400,000 |
| 2020 | $5,600 | $528,800 | $155,800 | $373,000 |
| 2019 | $5,522 | $491,300 | $148,400 | $342,900 |
| 2018 | $5,577 | $450,500 | $141,300 | $309,200 |
| 2017 | $5,493 | $451,800 | $134,600 | $317,200 |
| 2016 | $5,632 | $433,100 | $128,200 | $304,900 |
| 2015 | $1,208 | $444,700 | $125,100 | $319,600 |
| 2014 | -- | $82,115 | $82,115 | $0 |
| 2013 | -- | $102,100 | $102,100 | $0 |
Source: Public Records
Map
Nearby Homes
- 8381 Corcoran Cir Unit 49
- 8550 Corcoran Path
- 8590 Corcoran Path
- 8104 Dana Path
- 8086 Dana Path
- 8336 Cloman Ave
- 7996 Corey Path
- 3750 80th St E
- 8827 Coffman Path
- 8124 Clifford Cir
- 8361 Carew Ct
- 3901 Conroy Trail
- 3944 76th Way E
- 7944 Charles Way
- TBd Cahill Blvd Blvd
- 3861 Conroy Trail
- 3295 80th St E Unit 508
- 3617 76th Ln E
- 4049 75th St E
- 7614 Connie Ln
- 8620 Crismon Way
- 8630 Crismon Way
- 8608 Crismon Way
- 8593 Crismon Way
- 8578 Crimson Ct
- 8593 Crimson Way
- 8640 Crismon Way
- 8578 Crismon Ct
- 8663 Crismon Way
- 8587 Crimson Ct
- 8650 Crimson Way
- 8679 Crismon Way
- 8650 Crismon Way
- 8592 Crismon Way
- 4095 87th St E
- 8582 Crismon Way
- 8581 Crismon Ct
- 8660 Crismon Way
- 8570 Crismon Ct
- 4083 87th St E