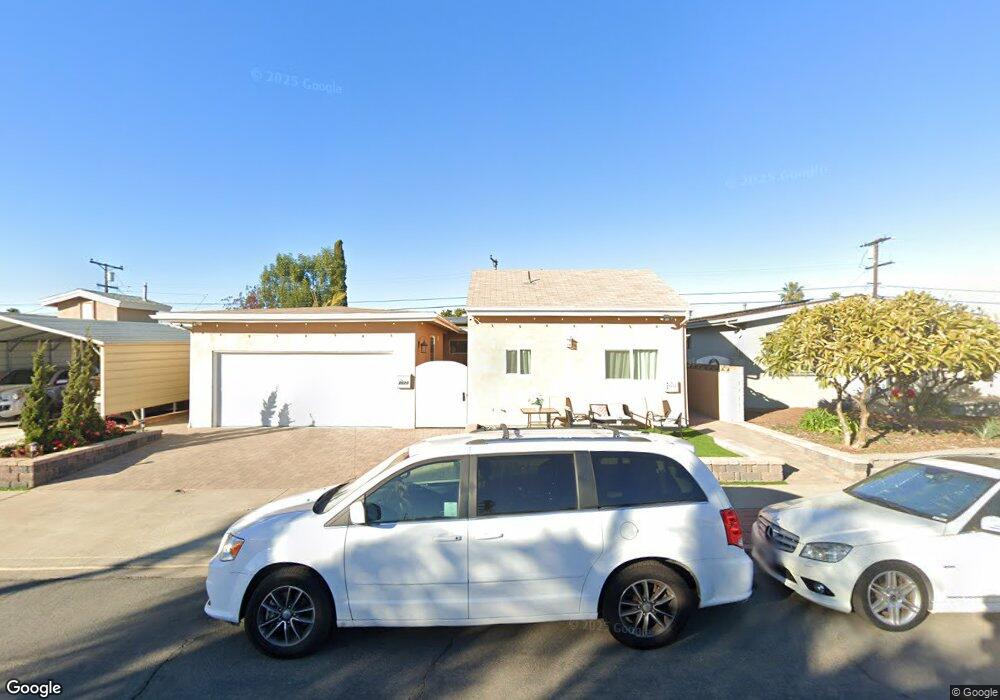
8620 Neva Ave San Diego, CA 92123
Serra Mesa NeighborhoodEstimated Value: $1,016,000 - $1,110,565
4
Beds
2
Baths
1,356
Sq Ft
$781/Sq Ft
Est. Value
About This Home
This home is located at 8620 Neva Ave, San Diego, CA 92123 and is currently estimated at $1,058,641, approximately $780 per square foot. 8620 Neva Ave is a home located in San Diego County with nearby schools including Jones Elementary School, Taft Middle School, and Elevate Elementary School.
Ownership History
Date
Name
Owned For
Owner Type
Purchase Details
Closed on
May 10, 2018
Sold by
Marmolejo Victor M and Alexander Kimberly S
Bought by
Marmolejo Victor and Alexander Kimberly
Current Estimated Value
Home Financials for this Owner
Home Financials are based on the most recent Mortgage that was taken out on this home.
Original Mortgage
$596,750
Outstanding Balance
$513,822
Interest Rate
4.4%
Mortgage Type
New Conventional
Estimated Equity
$544,819
Purchase Details
Closed on
Apr 5, 2017
Sold by
L&J Investment Properties Llc
Bought by
Marmolejo Victor M and Alexander Kimberly S
Home Financials for this Owner
Home Financials are based on the most recent Mortgage that was taken out on this home.
Original Mortgage
$579,313
Interest Rate
4.25%
Mortgage Type
FHA
Purchase Details
Closed on
Oct 31, 2016
Sold by
Chambers Keith V and Chambers Purita L
Bought by
L&J Investment Properties
Purchase Details
Closed on
Dec 31, 1986
Bought by
Chambers Keith V Purita L
Create a Home Valuation Report for This Property
The Home Valuation Report is an in-depth analysis detailing your home's value as well as a comparison with similar homes in the area
Home Values in the Area
Average Home Value in this Area
Purchase History
| Date | Buyer | Sale Price | Title Company |
|---|---|---|---|
| Marmolejo Victor | -- | First American Title Company | |
| Marmolejo Victor M | $590,000 | Chicago Title Company Sd | |
| L&J Investment Properties | $437,000 | Chicago Title Company | |
| Chambers Keith V Purita L | $125,000 | -- |
Source: Public Records
Mortgage History
| Date | Status | Borrower | Loan Amount |
|---|---|---|---|
| Open | Marmolejo Victor | $596,750 | |
| Closed | Marmolejo Victor M | $579,313 |
Source: Public Records
Tax History Compared to Growth
Tax History
| Year | Tax Paid | Tax Assessment Tax Assessment Total Assessment is a certain percentage of the fair market value that is determined by local assessors to be the total taxable value of land and additions on the property. | Land | Improvement |
|---|---|---|---|---|
| 2025 | $9,239 | $770,696 | $246,494 | $524,202 |
| 2024 | $9,239 | $755,585 | $241,661 | $513,924 |
| 2023 | $9,032 | $740,771 | $236,923 | $503,848 |
| 2022 | $8,790 | $726,247 | $232,278 | $493,969 |
| 2021 | $7,741 | $632,596 | $227,724 | $404,872 |
| 2020 | $7,647 | $626,110 | $225,389 | $400,721 |
| 2019 | $7,509 | $613,834 | $220,970 | $392,864 |
| 2018 | $7,019 | $601,799 | $216,638 | $385,161 |
| 2017 | $5,143 | $437,000 | $157,313 | $279,687 |
| 2016 | $2,368 | $206,129 | $74,203 | $131,926 |
| 2015 | $2,332 | $203,034 | $73,089 | $129,945 |
| 2014 | $2,295 | $199,058 | $71,658 | $127,400 |
Source: Public Records
Map
Nearby Homes
- 8805 Larkdale Ave
- 3216 Towser St
- 8874 Gowdy Ave
- 8805 Laddie Ln
- 3161 Skipper St
- 8955 Gramercy Dr
- 3531 Milagros St
- 8975 Gramercy Dr
- 8627 Anrol Ave
- 3488 Ediwhar Ave
- 3282 Berger Ave Unit D1
- 9120 Gramercy Dr Unit 319
- 9006 Haveteur Way
- 3541 Pomeroy St
- 2750 Walker Dr
- 2421 Casement St
- 9189 Village Glen Dr Unit 148
- 2673 Larkin Place
- 3454 Castle Glen Dr Unit 107
- 9192 Fermi Ave