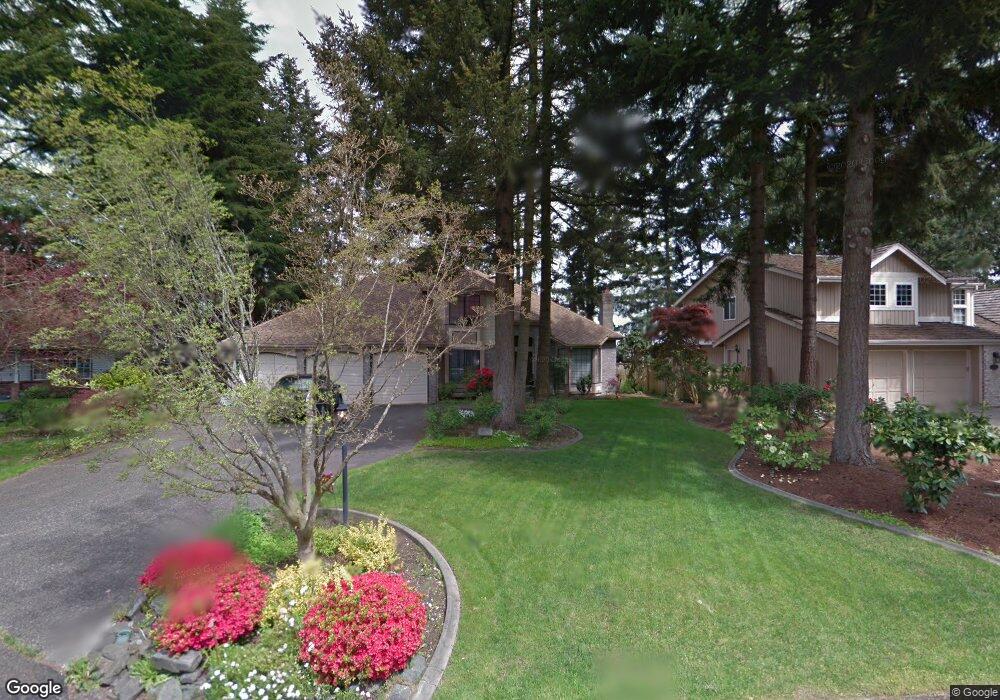
8621 164th St E Puyallup, WA 98375
Estimated Value: $640,000 - $675,000
3
Beds
3
Baths
2,583
Sq Ft
$255/Sq Ft
Est. Value
About This Home
This home is located at 8621 164th St E, Puyallup, WA 98375 and is currently estimated at $657,631, approximately $254 per square foot. 8621 164th St E is a home located in Pierce County with nearby schools including Brouillet Elementary School, Stahl Junior High, and Gov. John Rogers High School.
Ownership History
Date
Name
Owned For
Owner Type
Purchase Details
Closed on
Jul 21, 2015
Sold by
Barnett Cheryl
Bought by
Barnett Cheryl and Thompson Jimmy D
Current Estimated Value
Home Financials for this Owner
Home Financials are based on the most recent Mortgage that was taken out on this home.
Original Mortgage
$254,985
Outstanding Balance
$204,797
Interest Rate
4.75%
Mortgage Type
FHA
Estimated Equity
$452,834
Purchase Details
Closed on
Aug 8, 2001
Sold by
Sandys Steven Jeff
Bought by
Barnett Charles and Barnett Cheryl
Home Financials for this Owner
Home Financials are based on the most recent Mortgage that was taken out on this home.
Original Mortgage
$207,960
Interest Rate
9.99%
Purchase Details
Closed on
Nov 24, 1999
Sold by
Hunt John E
Bought by
Sandys Steven J and Sandys Elena
Home Financials for this Owner
Home Financials are based on the most recent Mortgage that was taken out on this home.
Original Mortgage
$150,000
Interest Rate
7.95%
Create a Home Valuation Report for This Property
The Home Valuation Report is an in-depth analysis detailing your home's value as well as a comparison with similar homes in the area
Home Values in the Area
Average Home Value in this Area
Purchase History
| Date | Buyer | Sale Price | Title Company |
|---|---|---|---|
| Barnett Cheryl | -- | Wfg Natl Title | |
| Barnett Charles | $259,950 | Transnation Title Insurance | |
| Sandys Steven J | $242,000 | Commonwealth Title Co |
Source: Public Records
Mortgage History
| Date | Status | Borrower | Loan Amount |
|---|---|---|---|
| Open | Barnett Cheryl | $254,985 | |
| Previous Owner | Barnett Charles | $207,960 | |
| Previous Owner | Sandys Steven J | $150,000 | |
| Closed | Barnett Charles | $51,990 |
Source: Public Records
Tax History Compared to Growth
Tax History
| Year | Tax Paid | Tax Assessment Tax Assessment Total Assessment is a certain percentage of the fair market value that is determined by local assessors to be the total taxable value of land and additions on the property. | Land | Improvement |
|---|---|---|---|---|
| 2025 | $6,402 | $660,100 | $171,300 | $488,800 |
| 2024 | $6,402 | $637,600 | $177,900 | $459,700 |
| 2023 | $6,402 | $604,500 | $177,900 | $426,600 |
| 2022 | $6,355 | $629,900 | $177,900 | $452,000 |
| 2021 | $6,043 | $469,200 | $127,700 | $341,500 |
| 2019 | $5,426 | $393,600 | $101,300 | $292,300 |
| 2018 | $5,473 | $402,700 | $97,300 | $305,400 |
| 2017 | $5,116 | $370,600 | $85,400 | $285,200 |
| 2016 | $4,947 | $309,600 | $67,500 | $242,100 |
| 2014 | $4,323 | $303,300 | $54,900 | $248,400 |
| 2013 | $4,323 | $271,900 | $48,600 | $223,300 |
Source: Public Records
Map
Nearby Homes
- 8612 165th Street Ct E
- 16022 89th Ave E
- 8515 166th Street Ct E
- 8824 161st Street Ct E
- 8518 167th Street Ct E
- 9013 161st Street Ct E
- 7714 166th St E
- 16317 81 Avenue Ct E
- 8904 158th St E
- 15823 83rd Ave E
- 15808 84th Ave E
- 9022 166th St E
- 16807 89th Ave E
- 15714 82nd Ave E Unit 5354
- 7920 161st Street Ct E
- 7922 165th Street Ct E
- 7918 165th Street Ct E
- 17018 84th Avenue Ct E
- 17003 83rd Avenue Ct E
- 7726 162nd St E
- 8623 164th St E
- 8619 164th St E
- 16223 86th Avenue Ct E
- 8709 164th St E
- 16215 86th Avenue Ct E
- 16220 86th Avenue Ct E
- 8617 164th St E
- 8622 164th St E
- 8616 164th St E
- 8620 164th St E
- 16402 87th Ave E
- 16211 86th Avenue Ct E
- 16308 87th Ave E
- 16304 87th Ave E
- 8711 164th St E
- 8618 164th St E
- 16214 87th Ave E
- 16212 86th Avenue Ct E