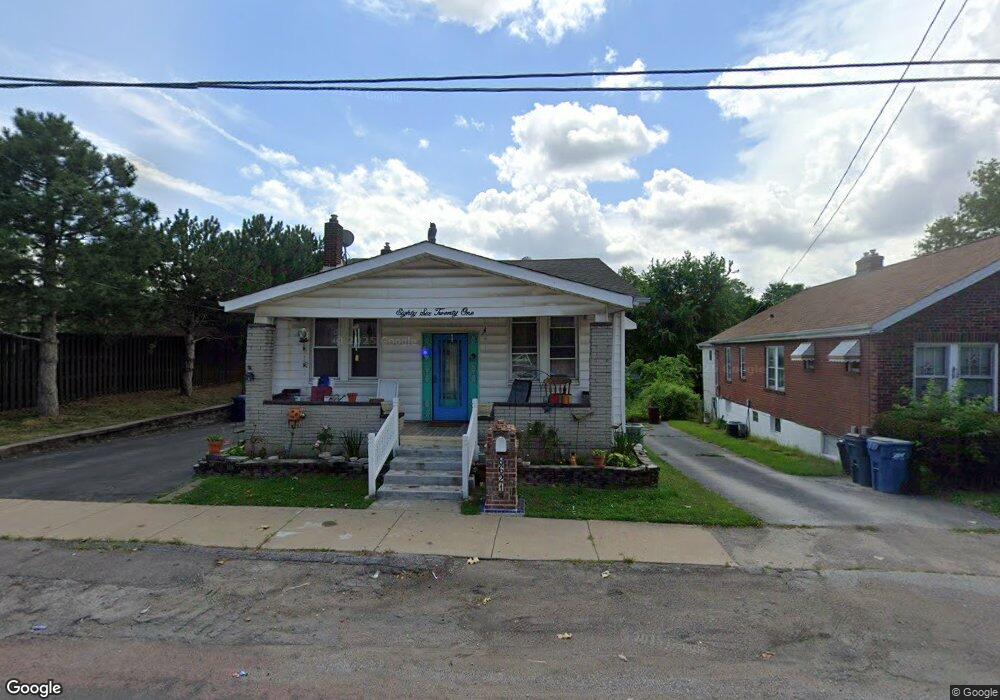
8621 Elgin Ave Saint Louis, MO 63123
Estimated Value: $249,000 - $290,000
3
Beds
3
Baths
2,161
Sq Ft
$124/Sq Ft
Est. Value
About This Home
This home is located at 8621 Elgin Ave, Saint Louis, MO 63123 and is currently estimated at $267,820, approximately $123 per square foot. 8621 Elgin Ave is a home located in St. Louis County with nearby schools including Mesnier Primary School, Gotsch Intermediate School, and Rogers Middle School.
Ownership History
Date
Name
Owned For
Owner Type
Purchase Details
Closed on
May 21, 2025
Sold by
Clubbs Debora F and Clubbs Leonard J
Bought by
Perez-Bernal Laura J
Current Estimated Value
Purchase Details
Closed on
Jul 1, 2010
Sold by
Davidson Lavel F and Davidson Merry A
Bought by
Clubbs Debora F and Clubbs Leonard J
Home Financials for this Owner
Home Financials are based on the most recent Mortgage that was taken out on this home.
Original Mortgage
$146,033
Interest Rate
5.25%
Mortgage Type
FHA
Purchase Details
Closed on
Dec 22, 2009
Sold by
Davidson Franklin L and Davidson Merry A
Bought by
Davidson Lavel F and Davidson Merry A
Home Financials for this Owner
Home Financials are based on the most recent Mortgage that was taken out on this home.
Original Mortgage
$122,000
Interest Rate
4.82%
Mortgage Type
New Conventional
Create a Home Valuation Report for This Property
The Home Valuation Report is an in-depth analysis detailing your home's value as well as a comparison with similar homes in the area
Home Values in the Area
Average Home Value in this Area
Purchase History
| Date | Buyer | Sale Price | Title Company |
|---|---|---|---|
| Perez-Bernal Laura J | -- | None Listed On Document | |
| Clubbs Debora F | $148,000 | Investors Title Company | |
| Davidson Lavel F | -- | Title Partners Agency Llc |
Source: Public Records
Mortgage History
| Date | Status | Borrower | Loan Amount |
|---|---|---|---|
| Previous Owner | Clubbs Debora F | $146,033 | |
| Previous Owner | Davidson Lavel F | $122,000 |
Source: Public Records
Tax History Compared to Growth
Tax History
| Year | Tax Paid | Tax Assessment Tax Assessment Total Assessment is a certain percentage of the fair market value that is determined by local assessors to be the total taxable value of land and additions on the property. | Land | Improvement |
|---|---|---|---|---|
| 2025 | $3,186 | $47,560 | $15,090 | $32,470 |
| 2024 | $3,186 | $39,520 | $10,070 | $29,450 |
| 2023 | $3,080 | $39,520 | $10,070 | $29,450 |
| 2022 | $2,919 | $34,110 | $10,070 | $24,040 |
| 2021 | $2,851 | $34,110 | $10,070 | $24,040 |
| 2020 | $3,057 | $34,150 | $9,790 | $24,360 |
| 2019 | $3,051 | $34,150 | $9,790 | $24,360 |
| 2018 | $2,869 | $28,370 | $6,820 | $21,550 |
| 2017 | $2,851 | $28,370 | $6,820 | $21,550 |
| 2016 | $1,848 | $19,460 | $3,970 | $15,490 |
| 2015 | $1,857 | $19,460 | $3,970 | $15,490 |
| 2014 | $2,470 | $25,880 | $4,240 | $21,640 |
Source: Public Records
Map
Nearby Homes
- 5515 Maxwell Ave
- 8550 Pilot Ave
- 8506 Mathilda Ave
- 5800 Langley Ave
- 8348 Vasel Dr
- 8515 Philo Ave
- 6211 Bixby Ave
- 9211 Niles Place
- 8305 Vasel Dr
- 8315 Maylor Dr
- 5331 Vine Ave
- 6236 Bixby Ave
- 5615 Willard Ave
- 5311 Vine Ave
- 8509 Mackenzie Rd
- 9506 Sterling Place
- 8505 Ava Dr
- 8032 Joel Ave
- 8029 Joel Ave
- 5309 Staely Ave