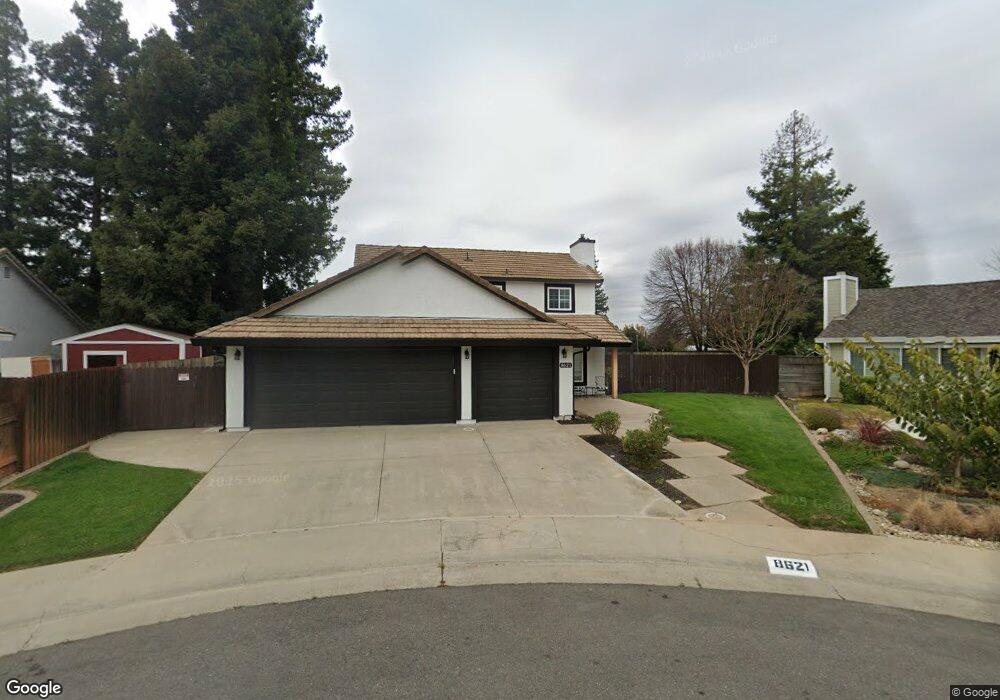
8621 Garnet Crest Ct Elk Grove, CA 95624
North East Elk Grove NeighborhoodEstimated Value: $454,000 - $593,000
3
Beds
3
Baths
1,454
Sq Ft
$367/Sq Ft
Est. Value
About This Home
This home is located at 8621 Garnet Crest Ct, Elk Grove, CA 95624 and is currently estimated at $534,021, approximately $367 per square foot. 8621 Garnet Crest Ct is a home located in Sacramento County with nearby schools including Ellen Feickert Elementary School, Joseph Kerr Middle School, and Elk Grove High School.
Ownership History
Date
Name
Owned For
Owner Type
Purchase Details
Closed on
Jul 26, 2024
Sold by
Harper Joshua
Bought by
Joshua W Harper Separate Property Trust and Harper
Current Estimated Value
Purchase Details
Closed on
Apr 23, 2024
Sold by
Hall Revocable Trust and Hall Francine Yvonne
Bought by
Harper Joshua
Purchase Details
Closed on
Jul 21, 2021
Sold by
Hall Francine
Bought by
Hall Francine Yvonne and Harper Danielle Nicole
Purchase Details
Closed on
Jun 20, 2013
Sold by
Simpson Gaylene
Bought by
Hall Francine
Home Financials for this Owner
Home Financials are based on the most recent Mortgage that was taken out on this home.
Original Mortgage
$225,834
Interest Rate
3.25%
Mortgage Type
FHA
Purchase Details
Closed on
Feb 18, 1998
Sold by
Reale Family Living Trust and Steven A
Bought by
Simpson Gaylene
Home Financials for this Owner
Home Financials are based on the most recent Mortgage that was taken out on this home.
Original Mortgage
$115,400
Interest Rate
6.97%
Create a Home Valuation Report for This Property
The Home Valuation Report is an in-depth analysis detailing your home's value as well as a comparison with similar homes in the area
Home Values in the Area
Average Home Value in this Area
Purchase History
| Date | Buyer | Sale Price | Title Company |
|---|---|---|---|
| Joshua W Harper Separate Property Trust | -- | None Listed On Document | |
| Harper Joshua | -- | None Listed On Document | |
| Hall Francine Yvonne | -- | None Available | |
| Hall Francine | $230,000 | North American Title Co Inc | |
| Simpson Gaylene | $116,000 | Chicago Title Co |
Source: Public Records
Mortgage History
| Date | Status | Borrower | Loan Amount |
|---|---|---|---|
| Previous Owner | Hall Francine | $225,834 | |
| Previous Owner | Simpson Gaylene | $115,400 |
Source: Public Records
Tax History Compared to Growth
Tax History
| Year | Tax Paid | Tax Assessment Tax Assessment Total Assessment is a certain percentage of the fair market value that is determined by local assessors to be the total taxable value of land and additions on the property. | Land | Improvement |
|---|---|---|---|---|
| 2025 | $3,109 | $581,400 | $173,400 | $408,000 |
| 2024 | $3,109 | $276,408 | $69,339 | $207,069 |
| 2023 | $3,029 | $270,989 | $67,980 | $203,009 |
| 2022 | $2,972 | $265,677 | $66,648 | $199,029 |
| 2021 | $2,857 | $260,469 | $65,342 | $195,127 |
| 2020 | $2,817 | $257,799 | $64,672 | $193,127 |
| 2019 | $2,762 | $252,745 | $63,404 | $189,341 |
| 2018 | $2,685 | $247,790 | $62,161 | $185,629 |
| 2017 | $2,650 | $242,933 | $60,943 | $181,990 |
| 2016 | $2,571 | $238,171 | $59,749 | $178,422 |
| 2015 | $2,522 | $234,594 | $58,852 | $175,742 |
| 2014 | $2,481 | $230,000 | $57,700 | $172,300 |
Source: Public Records
Map
Nearby Homes
- 8737 El Toreador Way
- 9455 E Stockton Blvd
- 8865 Halverson Dr
- 8804 On Ct
- 9333 Aizenberg Cir
- 9407 Aizenberg Cir
- 8841 Freemark Way
- 8966 Ivanpah Ct
- 8392 Red Fox Way
- 8896 Kelsey Dr
- 8770 Superb Cir
- 9011 Quail Cove Dr
- 8904 Hyperia Ct
- 9146 Quail Brook Cir
- 9497 Sara St
- 9040 Elk Grove Florin Rd
- 8930 2nd Ave
- 8742 Santa Ridge Cir
- 8360 Blackman Way
- 9219 Crowell Dr
- 8625 Garnet Crest Ct
- 8620 Ruby Crest Ct
- 8616 Ruby Crest Ct
- 8624 Ruby Crest Ct
- 8613 Garnet Crest Ct
- 9240 Egret Dr
- 8624 Garnet Crest Ct
- 9236 Egret Dr
- 9244 Egret Dr
- 8612 Ruby Crest Ct
- 8620 Garnet Crest Ct
- 8616 Garnet Crest Ct
- 9232 Egret Dr
- 9248 Egret Dr
- 8609 Garnet Crest Ct
- 9228 Egret Dr
- 8612 Garnet Crest Ct
- 8608 Ruby Crest Ct
- 9252 Egret Dr
- 8625 Ruby Crest Ct