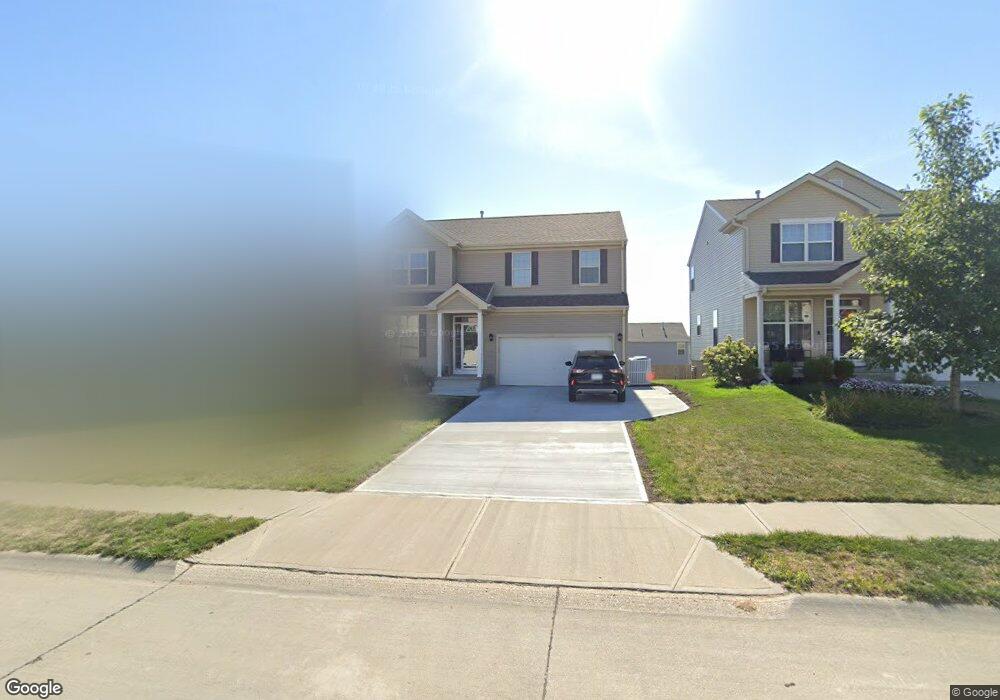
8623 S 164th St Omaha, NE 68136
Southwest Omaha NeighborhoodEstimated Value: $379,951 - $412,000
4
Beds
3
Baths
2,237
Sq Ft
$177/Sq Ft
Est. Value
About This Home
This home is located at 8623 S 164th St, Omaha, NE 68136 and is currently estimated at $394,988, approximately $176 per square foot. 8623 S 164th St is a home located in Sarpy County with nearby schools including Upchurch Elementary School, Millard South High School, and Harry Andersen Middle School.
Ownership History
Date
Name
Owned For
Owner Type
Purchase Details
Closed on
Jul 7, 2011
Sold by
Hearthstone Homes Inc
Bought by
Andary Mark and Andary Jin
Current Estimated Value
Home Financials for this Owner
Home Financials are based on the most recent Mortgage that was taken out on this home.
Original Mortgage
$150,000
Outstanding Balance
$103,293
Interest Rate
4.53%
Estimated Equity
$291,695
Purchase Details
Closed on
Feb 10, 2010
Sold by
Hearthstone Homes Inc
Bought by
Bye X Glenmoor & Meridian Park Llc
Home Financials for this Owner
Home Financials are based on the most recent Mortgage that was taken out on this home.
Original Mortgage
$798,309
Interest Rate
5.16%
Mortgage Type
Purchase Money Mortgage
Purchase Details
Closed on
Jul 28, 2009
Sold by
Boyer Young Equities V Llc
Bought by
Hearthstone Homes Inc
Create a Home Valuation Report for This Property
The Home Valuation Report is an in-depth analysis detailing your home's value as well as a comparison with similar homes in the area
Home Values in the Area
Average Home Value in this Area
Purchase History
| Date | Buyer | Sale Price | Title Company |
|---|---|---|---|
| Andary Mark | $175,000 | Fat | |
| Bye X Glenmoor & Meridian Park Llc | $1,227,000 | Pre | |
| Hearthstone Homes Inc | $16,000 | Fat | |
| Hearthstone Homes Inc | $129,000 | Fat |
Source: Public Records
Mortgage History
| Date | Status | Borrower | Loan Amount |
|---|---|---|---|
| Open | Andary Mark | $150,000 | |
| Previous Owner | Bye X Glenmoor & Meridian Park Llc | $798,309 |
Source: Public Records
Tax History Compared to Growth
Tax History
| Year | Tax Paid | Tax Assessment Tax Assessment Total Assessment is a certain percentage of the fair market value that is determined by local assessors to be the total taxable value of land and additions on the property. | Land | Improvement |
|---|---|---|---|---|
| 2025 | -- | $369,903 | $60,000 | $309,903 |
| 2024 | -- | $357,847 | $58,000 | $299,847 |
| 2023 | -- | $283,532 | $49,000 | $234,532 |
| 2022 | $0 | $249,190 | $41,000 | $208,190 |
| 2021 | $0 | $229,735 | $41,000 | $188,735 |
| 2020 | $0 | $224,526 | $41,000 | $183,526 |
| 2019 | $0 | $214,735 | $41,000 | $173,735 |
| 2018 | $0 | $204,945 | $35,000 | $169,945 |
| 2017 | $0 | $200,617 | $35,000 | $165,617 |
| 2016 | -- | $191,407 | $35,000 | $156,407 |
| 2015 | -- | $182,643 | $35,000 | $147,643 |
| 2014 | -- | $181,908 | $35,000 | $146,908 |
| 2012 | $4,623 | $176,517 | $35,000 | $141,517 |
Source: Public Records
Map
Nearby Homes
- 16251 Loop St
- 16228 Virginia St
- 16050 Cary St
- 16334 Heather St
- 8903 S 166th St
- 8809 S 167th St
- 16517 Loop St
- 8903 S 167th St
- 16498 Cinnamon Dr
- 16307 Birch Ave
- 8620 S 168th Ave
- 8711 S 169th St
- 16122 Birch Ave
- 8704 S 169th St
- 7853 S 162nd St
- 16528 Briar St
- 8013 S 159th St
- 17025 Centennial Rd
- 7734 S 162nd St
- 7810 S 166th St
- 8619 S 164th St
- 8627 S 164th St
- 8615 S 164th St
- 8631 S 164th St
- 8624 S 163rd Ave
- 8628 S 163rd Ave
- 8620 S 163rd Ave
- 8632 S 163rd Ave
- 8611 S 164th St
- 8618 S 164th St
- 8635 S 164th St
- 8622 S 164th St
- 8614 S 164th St
- 8636 S 163rd Ave
- 8616 S 163rd Ave
- 8610 S 164th St
- 8607 S 164th St
- 8626 S 164th St
- 8640 S 163rd Ave
- 8639 S 164th St