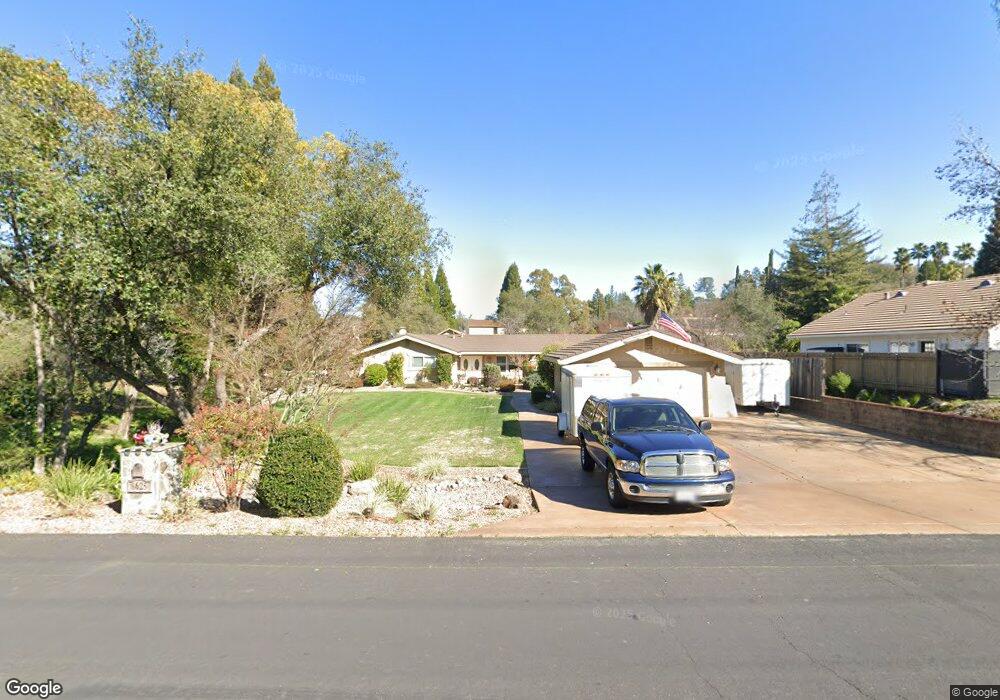
8625 Mooney Rd Granite Bay, CA 95746
Estimated Value: $401,000 - $878,000
4
Beds
2
Baths
1,711
Sq Ft
$400/Sq Ft
Est. Value
About This Home
This home is located at 8625 Mooney Rd, Granite Bay, CA 95746 and is currently estimated at $684,115, approximately $399 per square foot. 8625 Mooney Rd is a home located in Placer County with nearby schools including Greenhills Elementary School, Ridgeview Elementary School, and Willma Cavitt Junior High School.
Ownership History
Date
Name
Owned For
Owner Type
Purchase Details
Closed on
May 23, 2008
Sold by
Burnside Frank Thomas and Burnside Laurie Marie
Bought by
Burnside Frank Thomas and Burnside Laurie Marie
Current Estimated Value
Home Financials for this Owner
Home Financials are based on the most recent Mortgage that was taken out on this home.
Original Mortgage
$250,000
Outstanding Balance
$158,241
Interest Rate
5.87%
Mortgage Type
Stand Alone Refi Refinance Of Original Loan
Estimated Equity
$525,874
Purchase Details
Closed on
Jul 9, 2003
Sold by
Burnside Frank and Burnside Laurie
Bought by
Burnside Frank Thomas and Burnside Laurie Marie
Purchase Details
Closed on
Jun 18, 1998
Sold by
Bryson Wallace W and Bryson Wallace K
Bought by
Burnside Frank and Burnside Laurie
Home Financials for this Owner
Home Financials are based on the most recent Mortgage that was taken out on this home.
Original Mortgage
$153,100
Interest Rate
7.17%
Mortgage Type
Purchase Money Mortgage
Create a Home Valuation Report for This Property
The Home Valuation Report is an in-depth analysis detailing your home's value as well as a comparison with similar homes in the area
Home Values in the Area
Average Home Value in this Area
Purchase History
| Date | Buyer | Sale Price | Title Company |
|---|---|---|---|
| Burnside Frank Thomas | -- | Placer Title Company | |
| Burnside Frank Thomas | -- | Placer Title Company | |
| Burnside Frank Thomas | -- | -- | |
| Burnside Frank | $161,500 | Old Republic Title Company |
Source: Public Records
Mortgage History
| Date | Status | Borrower | Loan Amount |
|---|---|---|---|
| Open | Burnside Frank Thomas | $250,000 | |
| Closed | Burnside Frank | $153,100 |
Source: Public Records
Tax History Compared to Growth
Tax History
| Year | Tax Paid | Tax Assessment Tax Assessment Total Assessment is a certain percentage of the fair market value that is determined by local assessors to be the total taxable value of land and additions on the property. | Land | Improvement |
|---|---|---|---|---|
| 2025 | $3,361 | $257,360 | $95,788 | $161,572 |
| 2023 | $3,361 | $247,368 | $92,069 | $155,299 |
| 2022 | $3,310 | $242,518 | $90,264 | $152,254 |
| 2021 | $3,257 | $237,764 | $88,495 | $149,269 |
| 2020 | $3,248 | $235,327 | $87,588 | $147,739 |
| 2019 | $3,215 | $230,714 | $85,871 | $144,843 |
| 2018 | $3,098 | $226,191 | $84,188 | $142,003 |
| 2017 | $3,110 | $221,757 | $82,538 | $139,219 |
| 2016 | $3,051 | $217,410 | $80,920 | $136,490 |
| 2015 | $2,999 | $214,145 | $79,705 | $134,440 |
| 2014 | $2,961 | $209,951 | $78,144 | $131,807 |
Source: Public Records
Map
Nearby Homes
- 8420 Lakeland Dr
- 8432 W Granite Dr
- 8395 W Hidden Lakes Dr
- 7582 Lakeshore Dr
- 8293 Robert Ct
- 7537 Dove Ct
- 8465 Serene View Rd
- 8670 Lake Front Dr
- SOL3 Plan at Premier Soleil
- SOL1+ Plan at Premier Soleil
- SOL4 Plan at Premier Soleil
- SOL2 Plan at Premier Soleil
- SOL1 Plan at Premier Soleil
- 7080 Soleil Way
- 8177 E Granite Dr
- 8460 Sun View Cir
- 7070 Soleil Way
- 7090 Soleil Way
- 8461 Sun View Cir
- 8444 Sun View Cir
- 8605 Mooney Rd
- 8655 Mooney Rd
- 8626 Vane Ct
- 8600 Vane Ct
- 7647 Meadow Lark Ln
- 8610 Mooney Rd
- 8580 Vane Ct
- 8699 Vane Ct
- 8675 Mooney Rd
- 8689 Vane Ct
- 7637 Meadow Lark Ln
- 8675 Vane Ct
- 8555 Mooney Rd
- 7642 Meadow Lark Ln
- 8550 Vane Ct
- 7635 Red Bud Rd
- 8617 Vane Ct
- 8597 Vane Ct
- 7607 Meadow Lark Ln
- 7686 Douglas Blvd