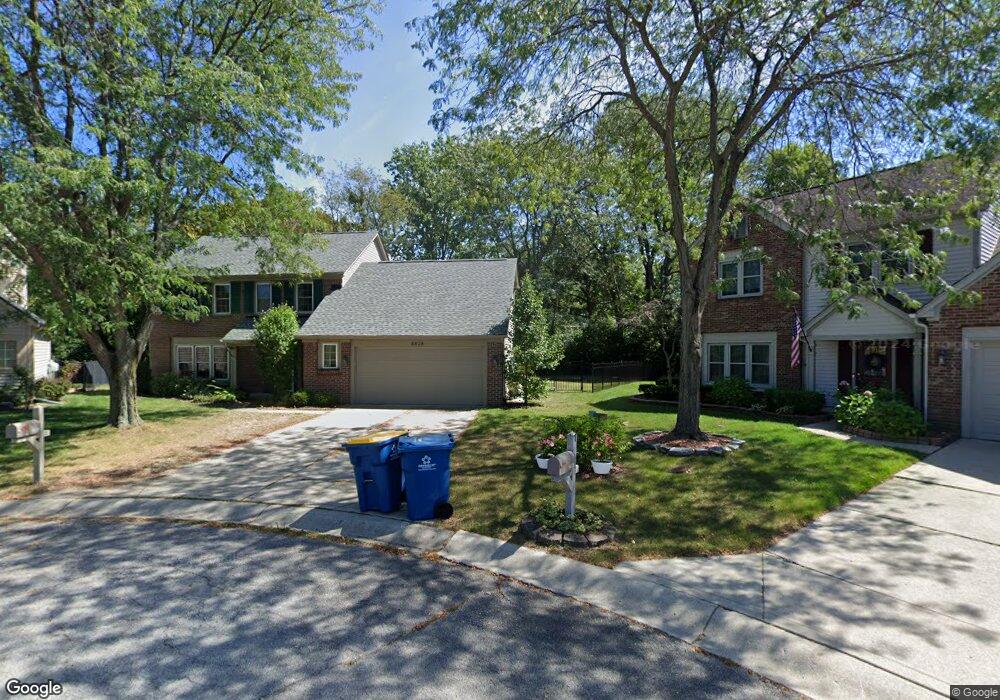
8626 Kruggle Ct Indianapolis, IN 46256
I-69 Fall Creek NeighborhoodEstimated Value: $329,000 - $336,000
3
Beds
3
Baths
1,649
Sq Ft
$201/Sq Ft
Est. Value
About This Home
This home is located at 8626 Kruggle Ct, Indianapolis, IN 46256 and is currently estimated at $332,207, approximately $201 per square foot. 8626 Kruggle Ct is a home located in Marion County with nearby schools including Mary Evelyn Castle Elementary School, Fall Creek Valley Middle School, and Lawrence North High School.
Ownership History
Date
Name
Owned For
Owner Type
Purchase Details
Closed on
May 8, 2024
Sold by
Coy Larz
Bought by
Knight Alexander and Knight Alton Madison
Current Estimated Value
Home Financials for this Owner
Home Financials are based on the most recent Mortgage that was taken out on this home.
Original Mortgage
$310,400
Outstanding Balance
$305,998
Interest Rate
6.82%
Mortgage Type
New Conventional
Estimated Equity
$26,209
Purchase Details
Closed on
Jun 29, 2020
Sold by
Parson Casey
Bought by
Coy Larz
Home Financials for this Owner
Home Financials are based on the most recent Mortgage that was taken out on this home.
Original Mortgage
$204,250
Interest Rate
3.2%
Mortgage Type
New Conventional
Purchase Details
Closed on
Sep 23, 2011
Sold by
Moriarty John D and Volk Laura L
Bought by
Parsons Casey
Home Financials for this Owner
Home Financials are based on the most recent Mortgage that was taken out on this home.
Original Mortgage
$136,205
Interest Rate
4.25%
Mortgage Type
FHA
Create a Home Valuation Report for This Property
The Home Valuation Report is an in-depth analysis detailing your home's value as well as a comparison with similar homes in the area
Home Values in the Area
Average Home Value in this Area
Purchase History
| Date | Buyer | Sale Price | Title Company |
|---|---|---|---|
| Knight Alexander | $333,000 | Chicago Title | |
| Coy Larz | $215,000 | Stewart Title | |
| Parsons Casey | -- | First American Title Ins Co |
Source: Public Records
Mortgage History
| Date | Status | Borrower | Loan Amount |
|---|---|---|---|
| Open | Knight Alexander | $310,400 | |
| Previous Owner | Coy Larz | $204,250 | |
| Previous Owner | Parsons Casey | $136,205 |
Source: Public Records
Tax History Compared to Growth
Tax History
| Year | Tax Paid | Tax Assessment Tax Assessment Total Assessment is a certain percentage of the fair market value that is determined by local assessors to be the total taxable value of land and additions on the property. | Land | Improvement |
|---|---|---|---|---|
| 2024 | $3,171 | $303,600 | $47,800 | $255,800 |
| 2023 | $3,171 | $283,700 | $47,800 | $235,900 |
| 2022 | $2,847 | $271,200 | $47,800 | $223,400 |
| 2021 | $2,483 | $215,800 | $27,300 | $188,500 |
| 2020 | $2,269 | $195,400 | $27,300 | $168,100 |
| 2019 | $1,975 | $189,400 | $27,300 | $162,100 |
| 2018 | $1,859 | $178,000 | $27,300 | $150,700 |
| 2017 | $1,696 | $161,900 | $27,300 | $134,600 |
| 2016 | $1,694 | $161,900 | $27,300 | $134,600 |
| 2014 | $1,622 | $162,200 | $27,300 | $134,900 |
| 2013 | $1,680 | $168,000 | $27,300 | $140,700 |
Source: Public Records
Map
Nearby Homes
- 8520 Hoff Ct
- 8807 Powderhorn Ln
- 8814 Powderhorn Ln
- 8962 Baywood Cir
- 8702 Woodstone Way W
- 8621 Cedar Key Dr
- 8508 Harrington Rd
- 8254 Cape Dr N
- 8596 Castle Farms Rd
- 8903 Buckhaven Dr
- 8212 Castlebrook Dr
- 9405 Champton Dr
- 9103 Sargent Rd
- 8054 Harvest Ln
- 8809 Haddington Dr N
- 8060 Castle Farms Ct
- 9532 Pinecreek Dr
- 8109 Castle Cove Rd
- 9554 E 86th St
- 8358 Hidden Point Dr
- 8620 Kruggle Ct
- 8621 Kruggle Ct
- 8614 Kruggle Ct
- 8702 Gunpowder Dr
- 8716 Powderhorn Ln
- 8615 Kruggle Ct
- 8658 Gunpowder Dr
- 8608 Kruggle Ct
- 8609 Kruggle Ct
- 8710 Powderhorn Ln
- 8722 Powderhorn Ln
- 8753 Woodstone Dr
- 8616 Burrell Ln
- 8602 Kruggle Ct
- 8650 Gunpowder Dr
- 8610 Burrell Ln
- 8603 Kruggle Ct
- 8759 Woodstone Dr
- 8604 Burrell Ln
- 8622 Burrell Ln