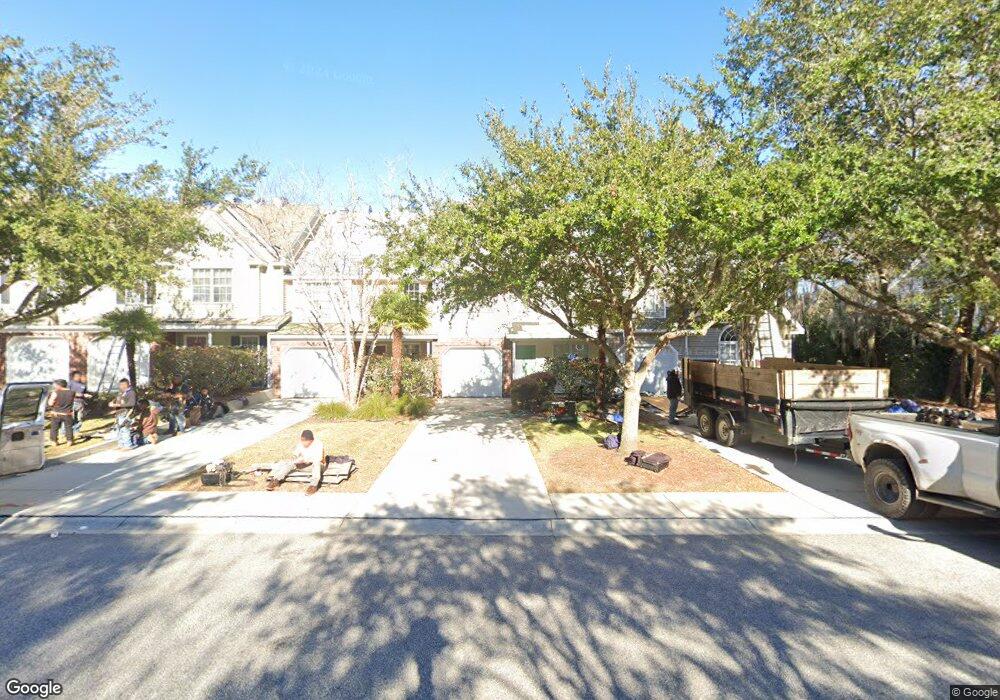
8628 Grassy Oak Trail North Charleston, SC 29420
Estimated Value: $260,000 - $280,000
3
Beds
3
Baths
1,603
Sq Ft
$168/Sq Ft
Est. Value
About This Home
This home is located at 8628 Grassy Oak Trail, North Charleston, SC 29420 and is currently estimated at $268,620, approximately $167 per square foot. 8628 Grassy Oak Trail is a home located in Dorchester County with nearby schools including Joseph R. Pye Elementary, River Oaks Middle School, and Fort Dorchester High School.
Ownership History
Date
Name
Owned For
Owner Type
Purchase Details
Closed on
Oct 21, 2011
Sold by
Dwivedi Peyush
Bought by
Sun Veda Llc
Current Estimated Value
Purchase Details
Closed on
Nov 8, 2010
Sold by
Wells Fargo Bank Na
Bought by
Dwivedi Peyush
Purchase Details
Closed on
May 19, 2010
Sold by
Gulotta Anthony P and Gulotta Lori A
Bought by
Wells Fargo Bank Na
Purchase Details
Closed on
Jun 20, 2005
Sold by
Hardy Jesse J and Hardy Shannon N
Bought by
Gulotta Anthony P and Gulotta Lori A
Home Financials for this Owner
Home Financials are based on the most recent Mortgage that was taken out on this home.
Original Mortgage
$30,800
Interest Rate
5.24%
Mortgage Type
Stand Alone Second
Purchase Details
Closed on
Apr 26, 2004
Sold by
Portrait Homes Coosaw Commons Llc
Bought by
Hardy Jesse J and Hardy Shannon N
Create a Home Valuation Report for This Property
The Home Valuation Report is an in-depth analysis detailing your home's value as well as a comparison with similar homes in the area
Home Values in the Area
Average Home Value in this Area
Purchase History
| Date | Buyer | Sale Price | Title Company |
|---|---|---|---|
| Sun Veda Llc | -- | -- | |
| Dwivedi Peyush | $112,000 | -- | |
| Wells Fargo Bank Na | $131,850 | -- | |
| Gulotta Anthony P | $154,000 | -- | |
| Hardy Jesse J | $136,143 | -- |
Source: Public Records
Mortgage History
| Date | Status | Borrower | Loan Amount |
|---|---|---|---|
| Previous Owner | Gulotta Anthony P | $30,800 | |
| Previous Owner | Gulotta Anthony P | $123,200 |
Source: Public Records
Tax History Compared to Growth
Tax History
| Year | Tax Paid | Tax Assessment Tax Assessment Total Assessment is a certain percentage of the fair market value that is determined by local assessors to be the total taxable value of land and additions on the property. | Land | Improvement |
|---|---|---|---|---|
| 2024 | $4,670 | $15,805 | $4,500 | $11,305 |
| 2023 | $4,670 | $9,443 | $1,800 | $7,643 |
| 2022 | $4,152 | $9,190 | $1,380 | $7,810 |
| 2021 | $4,152 | $9,190 | $1,380 | $7,810 |
| 2020 | $4,058 | $153,210 | $0 | $0 |
| 2019 | $4,026 | $153,210 | $0 | $0 |
| 2018 | $3,458 | $7,990 | $1,200 | $6,790 |
| 2017 | $3,397 | $7,990 | $1,200 | $6,790 |
| 2016 | $3,368 | $7,990 | $1,200 | $6,790 |
| 2015 | $3,363 | $7,990 | $1,200 | $6,790 |
| 2014 | $3,112 | $124,700 | $0 | $0 |
| 2013 | -- | $8,310 | $0 | $0 |
Source: Public Records
Map
Nearby Homes
- 5208 Fernland Way
- 8712 Grassy Oak Trail
- 8743 Grassy Oak Trail
- 8721 Grassy Oak Trail
- 8666 Grassy Oak Trail
- 8653 Grassy Oak Trail
- CARSON Plan at Patriot Park Townhomes
- 8522 Long Meadow Dr
- 8615 Arthur Hills Cir
- 8525 Long Meadow Dr
- 8631 Woodland Walk
- 8618 Woodland Walk
- 5401 Turgis Ct
- 0 Dorchester Rd Unit 24030438
- 4763 Horse Drawn Way
- 8800 Dorchester Rd Unit 3602
- 8800 Dorchester Rd Unit 2701
- 8800 Dorchester Rd Unit 1504
- 8800 Dorchester Rd Unit 1304
- 8800 Dorchester Rd Unit 504
- 8630 Grassy Oak Trail
- 8626 Grassy Oak Trail
- 8632 Grassy Oak Trail
- 8634 Grassy Oak Trail
- 8634 Grassy Oak Trail
- 8636 Grassy Oak Trail
- 5210 Fernland Way
- 5212 Fernland Way
- 8622 Grassy Oak Trail
- 8638 Grassy Oak Trail
- 8620 Grassy Oak Trail
- 5214 Fernland Way
- 5202 Fernland Way
- 8631 Grassy Oak Trail
- 5216 Fernland Way
- 5204 Fernland Way
- 8629 Grassy Oak Trail
- 5200 Fernland Way
- 5220 Fernland Way
- 8616 Grassy Oak Trail