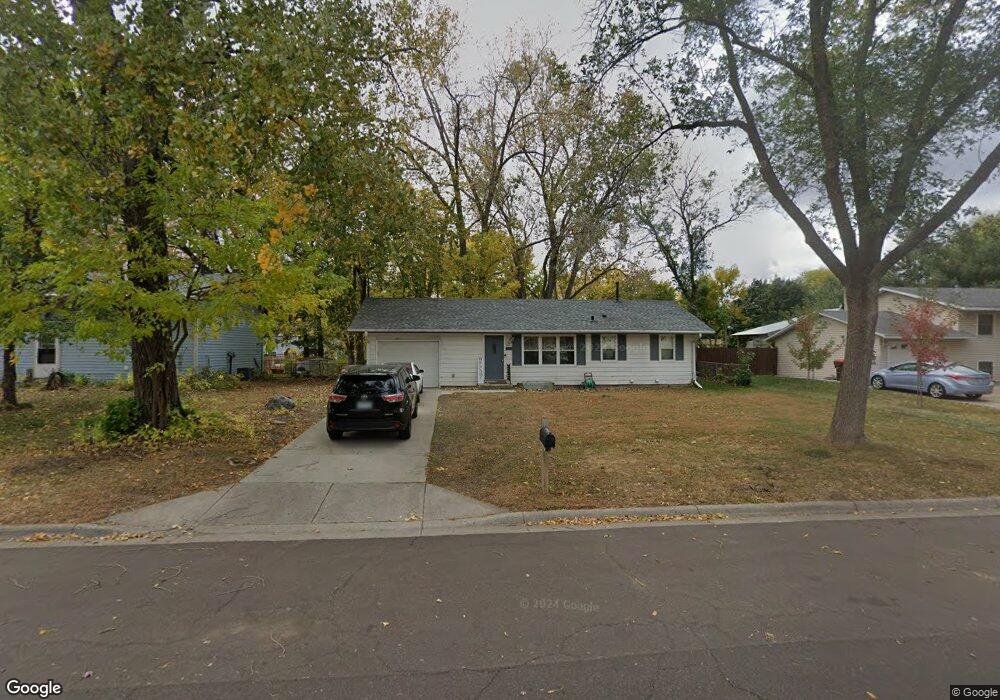
8628 Ingleside Ave S Cottage Grove, MN 55016
Estimated Value: $314,000 - $342,308
3
Beds
2
Baths
1,736
Sq Ft
$188/Sq Ft
Est. Value
About This Home
This home is located at 8628 Ingleside Ave S, Cottage Grove, MN 55016 and is currently estimated at $326,577, approximately $188 per square foot. 8628 Ingleside Ave S is a home located in Washington County with nearby schools including Hillside Elementary School, Cottage Grove Middle School, and Park Senior High School.
Ownership History
Date
Name
Owned For
Owner Type
Purchase Details
Closed on
Mar 19, 2020
Sold by
20176Wy 68 Llc
Bought by
Xiong Jenny Kia and Xiong Keng John
Current Estimated Value
Home Financials for this Owner
Home Financials are based on the most recent Mortgage that was taken out on this home.
Original Mortgage
$239,580
Outstanding Balance
$213,176
Interest Rate
3.75%
Mortgage Type
FHA
Estimated Equity
$113,401
Purchase Details
Closed on
Jul 16, 2019
Sold by
Nee Schottmuller Brenda and Nee Benjamin Good Supplemental
Bought by
20176Wy 68 Llc
Home Financials for this Owner
Home Financials are based on the most recent Mortgage that was taken out on this home.
Original Mortgage
$144,500
Interest Rate
3.82%
Mortgage Type
Commercial
Purchase Details
Closed on
Sep 25, 2013
Sold by
Good Shirley M
Bought by
Schottmuller Brenda and Good Robert
Create a Home Valuation Report for This Property
The Home Valuation Report is an in-depth analysis detailing your home's value as well as a comparison with similar homes in the area
Home Values in the Area
Average Home Value in this Area
Purchase History
| Date | Buyer | Sale Price | Title Company |
|---|---|---|---|
| Xiong Jenny Kia | $244,000 | Multiple | |
| 20176Wy 68 Llc | $40,000 | Land Title | |
| 20176Wy 68 Llc | $40,000 | Land Title | |
| Schottmuller Brenda | -- | None Available |
Source: Public Records
Mortgage History
| Date | Status | Borrower | Loan Amount |
|---|---|---|---|
| Open | Xiong Jenny Kia | $239,580 | |
| Previous Owner | 20176Wy 68 Llc | $144,500 |
Source: Public Records
Tax History Compared to Growth
Tax History
| Year | Tax Paid | Tax Assessment Tax Assessment Total Assessment is a certain percentage of the fair market value that is determined by local assessors to be the total taxable value of land and additions on the property. | Land | Improvement |
|---|---|---|---|---|
| 2024 | $3,570 | $291,400 | $100,000 | $191,400 |
| 2023 | $3,570 | $314,300 | $120,000 | $194,300 |
| 2022 | $3,204 | $291,400 | $110,400 | $181,000 |
| 2021 | $3,044 | $242,000 | $91,700 | $150,300 |
| 2020 | $2,836 | $233,400 | $93,000 | $140,400 |
| 2019 | $2,380 | $199,200 | $85,000 | $114,200 |
| 2018 | $2,244 | $178,600 | $78,000 | $100,600 |
| 2017 | $1,864 | $167,000 | $74,000 | $93,000 |
| 2016 | $1,998 | $145,100 | $54,000 | $91,100 |
| 2015 | $1,726 | $122,300 | $46,800 | $75,500 |
| 2013 | -- | $102,200 | $40,400 | $61,800 |
Source: Public Records
Map
Nearby Homes
- 8331 88th St S
- 8656 Imperial Ave S
- 8594 88th St S
- 8664 88th St S
- 8775 Iden Ave S
- 8547 Hinton Ave S
- 8355 Foothill Rd S
- 8460 Hyde Ave S
- 8390 81st St S
- 7928 Hillside Trail S
- 8070 Ingleside Ave S
- 8458 Ivywood Ave S
- 8433 79th St S
- 8011 80th St S
- 8063 Homestead Ave S
- 9013 91st St S
- 8112 Janero Ave S
- The Becker Plan at Mississippi Landing
- The Barrett Plan at Mississippi Landing
- The Brookston Plan at Mississippi Landing
- 8612 Ingleside Ave S
- 8642 Ingleside Ave S
- 8615 Ingersoll Ave S
- 8586 Ingleside Ave S
- 8660 Ingleside Ave S
- 8643 Ingersoll Ave S
- 8601 Ingersoll Ave S
- 8633 Ingleside Ave S
- 8613 Ingleside Ave S
- 8655 Ingleside Ave S
- 8657 Ingersoll Ave S
- 8562 Ingleside Ave S
- 8587 Ingleside Ave S
- 8678 Ingleside Ave S
- 8579 Ingersoll Ave S
- 8675 Ingleside Ave S
- 8671 Ingersoll Ave S
- 8563 Ingleside Ave S
- 8557 Ingersoll Ave S
- 8377 87th St S