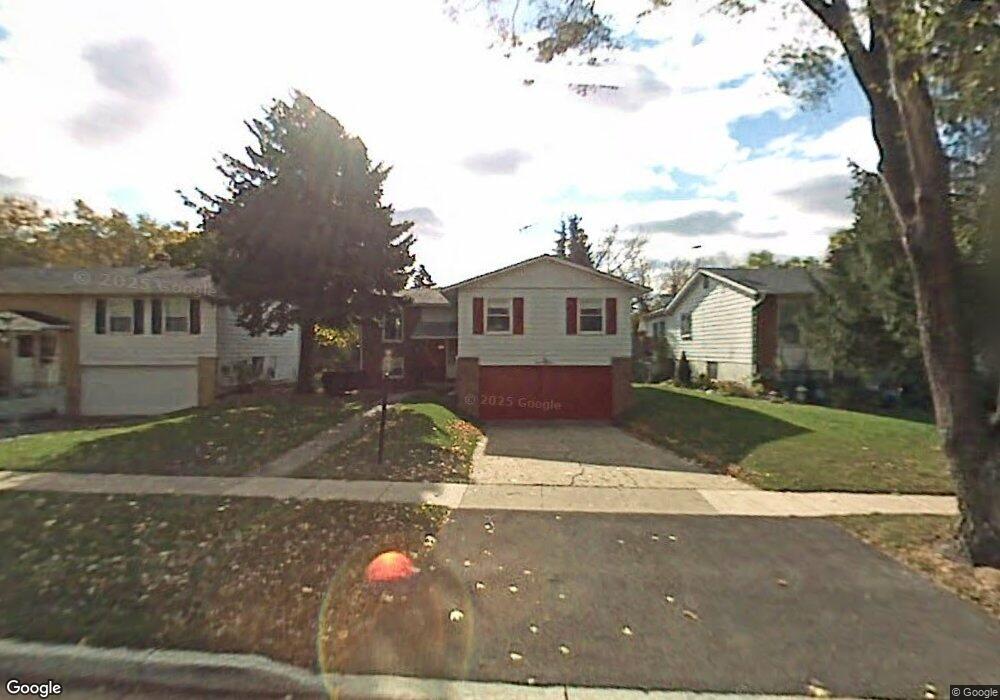
863 Glenview Ave Mundelein, IL 60060
Estimated Value: $314,000 - $341,000
3
Beds
2
Baths
1,182
Sq Ft
$279/Sq Ft
Est. Value
About This Home
This home is located at 863 Glenview Ave, Mundelein, IL 60060 and is currently estimated at $329,781, approximately $279 per square foot. 863 Glenview Ave is a home located in Lake County with nearby schools including Mechanics Grove Elementary School, Washington Early Learning Center, and Carl Sandburg Middle School.
Ownership History
Date
Name
Owned For
Owner Type
Purchase Details
Closed on
Jun 19, 2017
Sold by
Beller Dennis
Bought by
Beller Matthew and Beller Brian
Current Estimated Value
Home Financials for this Owner
Home Financials are based on the most recent Mortgage that was taken out on this home.
Original Mortgage
$125,000
Outstanding Balance
$104,002
Interest Rate
4.03%
Mortgage Type
New Conventional
Estimated Equity
$225,779
Purchase Details
Closed on
May 30, 2017
Sold by
Garrett Henry W
Bought by
Beller Matthew and Beller Brian
Home Financials for this Owner
Home Financials are based on the most recent Mortgage that was taken out on this home.
Original Mortgage
$125,000
Outstanding Balance
$104,002
Interest Rate
4.03%
Mortgage Type
New Conventional
Estimated Equity
$225,779
Create a Home Valuation Report for This Property
The Home Valuation Report is an in-depth analysis detailing your home's value as well as a comparison with similar homes in the area
Home Values in the Area
Average Home Value in this Area
Purchase History
| Date | Buyer | Sale Price | Title Company |
|---|---|---|---|
| Beller Matthew | -- | Attorney | |
| Beller Matthew | $187,000 | Attorneys Title Guaranty Fu |
Source: Public Records
Mortgage History
| Date | Status | Borrower | Loan Amount |
|---|---|---|---|
| Open | Beller Matthew | $125,000 |
Source: Public Records
Tax History Compared to Growth
Tax History
| Year | Tax Paid | Tax Assessment Tax Assessment Total Assessment is a certain percentage of the fair market value that is determined by local assessors to be the total taxable value of land and additions on the property. | Land | Improvement |
|---|---|---|---|---|
| 2024 | $8,642 | $97,545 | $17,149 | $80,396 |
| 2023 | $7,730 | $89,376 | $15,713 | $73,663 |
| 2022 | $7,730 | $77,857 | $15,079 | $62,778 |
| 2021 | $7,389 | $75,130 | $14,551 | $60,579 |
| 2020 | $7,266 | $73,063 | $14,151 | $58,912 |
| 2019 | $7,563 | $75,565 | $13,686 | $61,879 |
| 2018 | $6,024 | $62,327 | $13,098 | $49,229 |
| 2017 | $5,843 | $63,557 | $12,686 | $50,871 |
| 2016 | $5,651 | $60,364 | $12,049 | $48,315 |
| 2015 | $5,458 | $56,590 | $11,296 | $45,294 |
| 2014 | $5,265 | $55,722 | $11,196 | $44,526 |
| 2012 | $5,459 | $56,216 | $11,295 | $44,921 |
Source: Public Records
Map
Nearby Homes
- 851 Glenview Ave
- 547 N Ridgemoor Ave
- 728 W Maple Ave
- 522 W Park St
- 973 Highland Rd
- 1021 Wrens Gate
- 212 Londonderry Ct
- 1152 Aberdeen Ln
- 742 N Lake St
- 191 Springbrook Ct
- 1285 Appleby Cir
- 1010 Evergreen St Unit 3
- 201 Bingham Cir
- 116 N Prairie Ave
- 1349 Spalding Dr
- 95 N Southport Rd
- 137 Racine Place
- 883 W Courtland St
- 1632 Brighton Dr
- 51 S Pershing Ave
- 857 Glenview Ave
- 869 Glenview Ave
- 915 Glenview Ave
- 868 Bonniebrook Ave
- 862 Bonniebrook Ave
- 914 Bonniebrook Ave
- 921 Glenview Ave
- 856 Bonniebrook Ave
- 920 Bonniebrook Ave
- 630 N Ridgemoor Ave
- 636 N Ridgemoor Ave
- 850 Bonniebrook Ave
- 862 Glenview Ave
- 856 Glenview Ave
- 624 N Ridgemoor Ave
- 868 Glenview Ave
- 950 Bonniebrook Ave
- 850 Glenview Ave
- 914 Glenview Ave
- 618 N Ridgemoor Ave