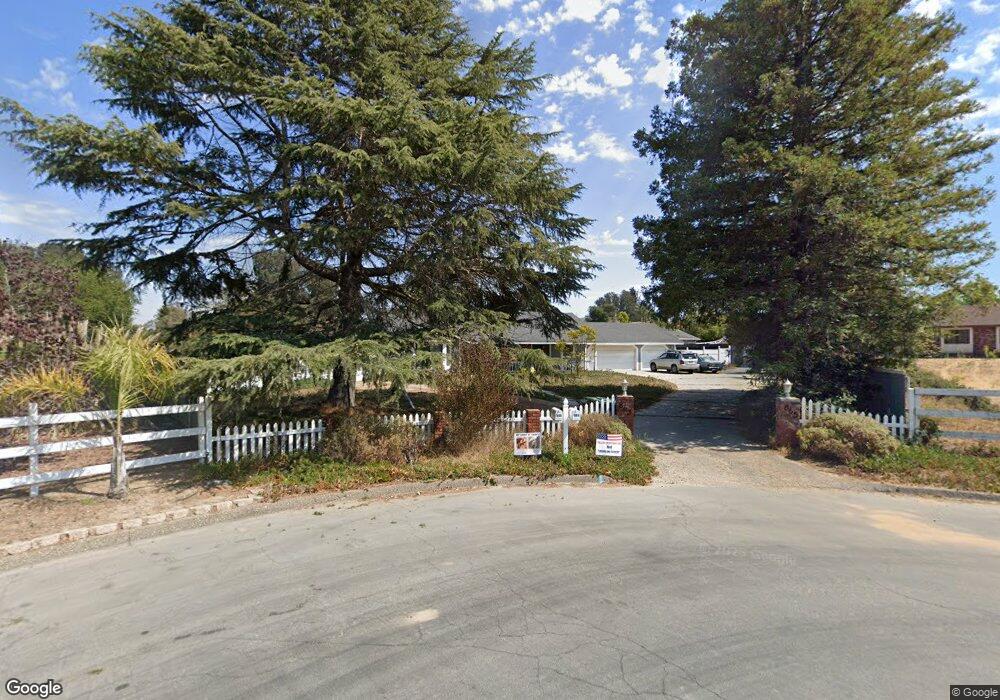
863 Peggy Lee Ct Nipomo, CA 93444
Estimated Value: $999,583 - $1,267,000
3
Beds
2
Baths
2,351
Sq Ft
$482/Sq Ft
Est. Value
About This Home
This home is located at 863 Peggy Lee Ct, Nipomo, CA 93444 and is currently estimated at $1,132,896, approximately $481 per square foot. 863 Peggy Lee Ct is a home located in San Luis Obispo County with nearby schools including Dana Elementary School, Mesa Middle School, and Nipomo High School.
Ownership History
Date
Name
Owned For
Owner Type
Purchase Details
Closed on
Dec 15, 2020
Sold by
Jackson Jenifer
Bought by
Jackson Kendall Robert and The Kendall Robert Jackson Fam
Current Estimated Value
Home Financials for this Owner
Home Financials are based on the most recent Mortgage that was taken out on this home.
Original Mortgage
$568,000
Outstanding Balance
$504,523
Interest Rate
2.7%
Mortgage Type
New Conventional
Estimated Equity
$628,373
Purchase Details
Closed on
Nov 5, 2020
Sold by
Johnson J and Estate Of Helen Roe Jackson
Bought by
Jackson Kendall Robert and The Kendall Robert Jackson Fam
Home Financials for this Owner
Home Financials are based on the most recent Mortgage that was taken out on this home.
Original Mortgage
$568,000
Outstanding Balance
$504,523
Interest Rate
2.7%
Mortgage Type
New Conventional
Estimated Equity
$628,373
Purchase Details
Closed on
Aug 5, 2003
Sold by
Jackson Kendall R and Jackson Helen R
Bought by
Jackson Kendall R and Jackson Helen R
Home Financials for this Owner
Home Financials are based on the most recent Mortgage that was taken out on this home.
Original Mortgage
$318,000
Interest Rate
6.29%
Mortgage Type
New Conventional
Purchase Details
Closed on
Oct 9, 2002
Sold by
Jackson Kendall R and Jackson Helen R
Bought by
Jackson Kendall R and Jackson Helen R
Home Financials for this Owner
Home Financials are based on the most recent Mortgage that was taken out on this home.
Original Mortgage
$300,700
Interest Rate
6.05%
Purchase Details
Closed on
Sep 18, 2002
Sold by
Jackson Kendall R and Jackson Helen R
Bought by
Jackson Kendall R and Jackson Helen R
Home Financials for this Owner
Home Financials are based on the most recent Mortgage that was taken out on this home.
Original Mortgage
$300,700
Interest Rate
6.05%
Purchase Details
Closed on
Aug 10, 1998
Sold by
Jackson Kendall R and Jackson Helen R
Bought by
Jackson Kendall R and Jackson Helen R
Purchase Details
Closed on
Jul 26, 1994
Sold by
Mid State Bank
Bought by
Jackson Kendall R and Jackson Helen R
Home Financials for this Owner
Home Financials are based on the most recent Mortgage that was taken out on this home.
Original Mortgage
$198,400
Interest Rate
8.61%
Purchase Details
Closed on
Dec 14, 1993
Sold by
Msb Properties Inc
Bought by
Mid State Bank
Create a Home Valuation Report for This Property
The Home Valuation Report is an in-depth analysis detailing your home's value as well as a comparison with similar homes in the area
Home Values in the Area
Average Home Value in this Area
Purchase History
| Date | Buyer | Sale Price | Title Company |
|---|---|---|---|
| Jackson Kendall Robert | -- | First American Title Company | |
| Jackson Kendall Robert | $710,000 | First American Title Company | |
| Jackson Kendall R | -- | First American Title Company | |
| Jackson Kendall R | -- | First American Title Company | |
| Jackson Kendall R | -- | First American Title Company | |
| Jackson Kendall R | -- | -- | |
| Jackson Kendall R | $248,000 | Chicago Title Company | |
| Mid State Bank | $277,783 | Cuesta Title |
Source: Public Records
Mortgage History
| Date | Status | Borrower | Loan Amount |
|---|---|---|---|
| Open | Jackson Kendall Robert | $568,000 | |
| Previous Owner | Jackson Kendall R | $318,000 | |
| Previous Owner | Jackson Kendall R | $300,700 | |
| Previous Owner | Jackson Kendall R | $198,400 | |
| Closed | Jackson Kendall R | $25,000 |
Source: Public Records
Tax History Compared to Growth
Tax History
| Year | Tax Paid | Tax Assessment Tax Assessment Total Assessment is a certain percentage of the fair market value that is determined by local assessors to be the total taxable value of land and additions on the property. | Land | Improvement |
|---|---|---|---|---|
| 2025 | $8,304 | $814,426 | $280,808 | $533,618 |
| 2024 | $7,740 | $798,457 | $275,302 | $523,155 |
| 2023 | $7,740 | $738,684 | $260,100 | $478,584 |
| 2022 | $7,622 | $724,200 | $255,000 | $469,200 |
| 2021 | $7,607 | $710,000 | $250,000 | $460,000 |
| 2020 | $4,654 | $437,598 | $153,572 | $284,026 |
| 2019 | $4,624 | $429,018 | $150,561 | $278,457 |
| 2018 | $4,567 | $420,607 | $147,609 | $272,998 |
| 2017 | $4,480 | $412,361 | $144,715 | $267,646 |
| 2016 | $4,224 | $404,277 | $141,878 | $262,399 |
| 2015 | $4,162 | $398,205 | $139,747 | $258,458 |
| 2014 | $4,006 | $390,406 | $137,010 | $253,396 |
Source: Public Records
Map
Nearby Homes
- 940 Calle Fresa
- 620 Camino Roble
- 615 Sweet Donna Place
- 1010 1012 Upper Los Berros Rd
- 7855 Suey Creek Rd
- 1225 Dawn Rd
- 1150 Redberry Place
- 1060 Dawn Rd
- 875 Camino Caballo
- 219 Lema Dr
- 1024 Maggie Ln
- 217 Hope Way
- 1354 Trail View Place
- 639 Barberry Way
- 1255 Viva Way
- 231 Trevino Dr
- 1084 Emma Ln
- 1337 Black Sage Cir
- 228 Chaparral Ln
- 255 Encino Ln
- 928 Hunter Ridge Ln
- 873 Peggy Lee Ct
- 862 Peggy Lee Ct
- 883 Peggy Lee Ct
- 936 Hunter Ridge Ln
- 912 Hunter Ridge Ln
- 872 Peggy Lee Ct
- 917 Hunter Ridge Ln
- 925 Hunter Ridge Ln
- 882 Peggy Lee Ct
- 935 Waypoint Dr
- 874 Patty Kay Ct
- 864 Patty Kay Ct
- 917 Blue Gum Ln
- 929 Hunter Ridge Ln
- 884 Patty Kay Ct
- 892 Peggy Lee Ct
- 909 Hunter Ridge Ln
- 925 Blue Gum Ln
- 865 Patty Kay Ct