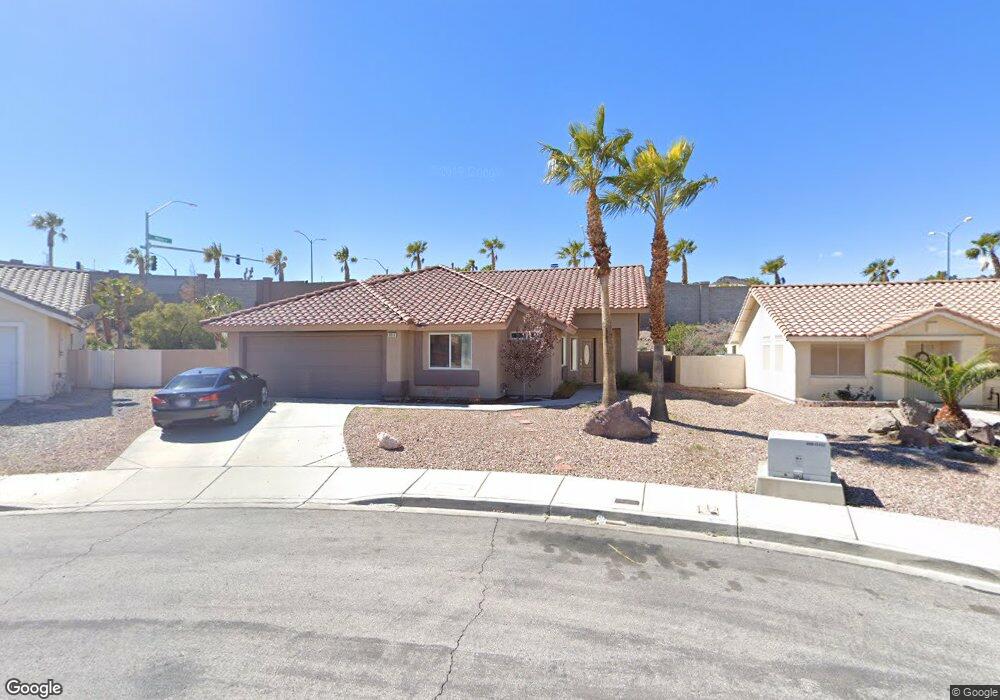
863 Rusty Anchor Way Henderson, NV 89002
Paradise Hills NeighborhoodEstimated Value: $500,000 - $594,000
4
Beds
3
Baths
2,018
Sq Ft
$270/Sq Ft
Est. Value
About This Home
This home is located at 863 Rusty Anchor Way, Henderson, NV 89002 and is currently estimated at $545,074, approximately $270 per square foot. 863 Rusty Anchor Way is a home located in Clark County with nearby schools including J. Marlan Walker International School, Jack & Terry Mannion Middle School, and Foothill High School.
Ownership History
Date
Name
Owned For
Owner Type
Purchase Details
Closed on
Oct 28, 2015
Sold by
Shay Diane and Skinner Diane
Bought by
Ferguson Kevin Patrick and Ferguson Rachel Elaine
Current Estimated Value
Purchase Details
Closed on
May 20, 2011
Sold by
Braae John Robert and Braae Marcia Ruth
Bought by
Skinner Diane
Home Financials for this Owner
Home Financials are based on the most recent Mortgage that was taken out on this home.
Original Mortgage
$160,817
Interest Rate
5.5%
Mortgage Type
FHA
Purchase Details
Closed on
May 31, 1998
Sold by
Braae John Robert
Bought by
Braae John Robert and Braae Marcia Ruth
Purchase Details
Closed on
Dec 21, 1996
Sold by
Rainbow Canyon Ltd Liability Company
Bought by
Braae John Robert
Home Financials for this Owner
Home Financials are based on the most recent Mortgage that was taken out on this home.
Original Mortgage
$139,179
Interest Rate
7.53%
Mortgage Type
VA
Create a Home Valuation Report for This Property
The Home Valuation Report is an in-depth analysis detailing your home's value as well as a comparison with similar homes in the area
Home Values in the Area
Average Home Value in this Area
Purchase History
| Date | Buyer | Sale Price | Title Company |
|---|---|---|---|
| Ferguson Kevin Patrick | $315,000 | Ticor Title Las Vegas | |
| Shay Diane | -- | Ticor Title Las Vegas | |
| Skinner Diane | $165,000 | Lawyers Title Of Nevada Vil | |
| Braae John Robert | -- | -- | |
| Braae John Robert | $138,000 | United Title |
Source: Public Records
Mortgage History
| Date | Status | Borrower | Loan Amount |
|---|---|---|---|
| Previous Owner | Skinner Diane | $160,817 | |
| Previous Owner | Braae John Robert | $139,179 |
Source: Public Records
Tax History Compared to Growth
Tax History
| Year | Tax Paid | Tax Assessment Tax Assessment Total Assessment is a certain percentage of the fair market value that is determined by local assessors to be the total taxable value of land and additions on the property. | Land | Improvement |
|---|---|---|---|---|
| 2025 | $2,369 | $115,499 | $32,725 | $82,774 |
| 2024 | $2,301 | $115,499 | $32,725 | $82,774 |
| 2023 | $2,412 | $117,638 | $39,270 | $78,368 |
| 2022 | $2,449 | $106,683 | $34,650 | $72,033 |
| 2021 | $2,268 | $98,281 | $29,645 | $68,636 |
| 2020 | $2,103 | $97,861 | $29,645 | $68,216 |
| 2019 | $1,971 | $92,567 | $25,410 | $67,157 |
| 2018 | $1,880 | $86,770 | $21,945 | $64,825 |
| 2017 | $2,490 | $85,900 | $20,020 | $65,880 |
| 2016 | $1,761 | $80,575 | $14,630 | $65,945 |
| 2015 | $1,757 | $73,859 | $11,935 | $61,924 |
| 2014 | $1,702 | $58,373 | $10,780 | $47,593 |
Source: Public Records
Map
Nearby Homes
- 837 Holly Lake Way
- 107 Mint Orchard Dr
- 132 Westin Ln
- 110 Mint Orchard Dr
- 1010 Silver Retreat Ct
- 780 Vortex Ave
- 131 Park Ridge Ln
- 815 Sun Bridge Ln
- 43 Pangloss St
- 730 Descartes Ave
- 787 Craigmark Ct
- 0 E Mission Dr
- 805 Blue Springs Dr
- 1044 Spanish Needle St
- 1014 Pleasing Plateau St
- 181 Ridge Crossing Ave
- 719 Descartes Ave
- 128 Rancho Maderas Way
- 767 Wigan Pier Dr Unit 5
- 1034 Copper Palm Ct
- 861 Rusty Anchor Way
- 105 Westin Ln
- 859 Rusty Anchor Way
- 107 Westin Ln
- 108 Westin Ln
- 109 Westin Ln
- 110 Westin Ln
- 858 Rusty Anchor Way
- 798 Alder Green Ave
- 796 Alder Green Ave
- 855 Rusty Anchor Way
- 111 Westin Ln
- 794 Alder Green Ave
- 856 Rusty Anchor Way
- 112 Westin Ln
- 1 Pangloss St
- 1001 Amber Gate St
- 792 Alder Green Ave
- 113 Westin Ln
- 854 Rusty Anchor Way