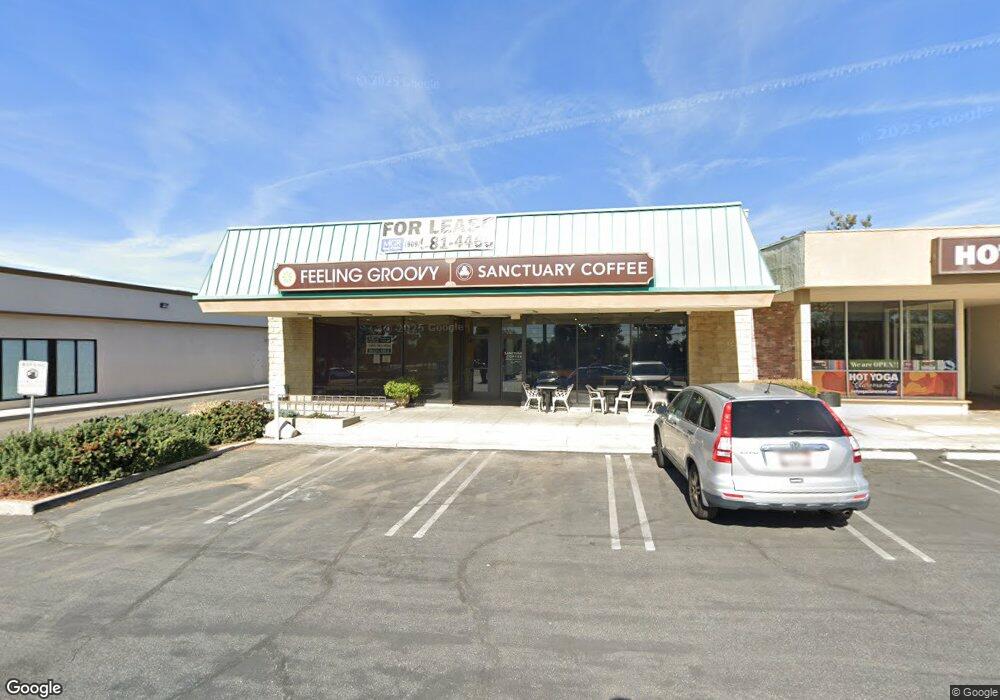
863 W Foothill Blvd Claremont, CA 91711
Condit NeighborhoodEstimated Value: $2,776,688
--
Bed
--
Bath
6,100
Sq Ft
$455/Sq Ft
Est. Value
About This Home
This home is located at 863 W Foothill Blvd, Claremont, CA 91711 and is currently estimated at $2,776,688, approximately $455 per square foot. 863 W Foothill Blvd is a home located in Los Angeles County with nearby schools including Condit Elementary School, El Roble Intermediate School, and Claremont High School.
Ownership History
Date
Name
Owned For
Owner Type
Purchase Details
Closed on
Aug 24, 2018
Sold by
Ziese William J and The William And Norma Ziese Fa
Bought by
Ziese William J and The Bypass Trust Of The Willia
Current Estimated Value
Purchase Details
Closed on
Oct 3, 2012
Sold by
Torry Holdings Llc
Bought by
Ziese William J and Ziese Norma L
Home Financials for this Owner
Home Financials are based on the most recent Mortgage that was taken out on this home.
Original Mortgage
$650,000
Interest Rate
3.37%
Mortgage Type
Commercial
Purchase Details
Closed on
Sep 8, 2008
Sold by
Torry Dale A and Torry Adrienne D
Bought by
Torry Holdings Llc
Purchase Details
Closed on
Jun 9, 2008
Sold by
Delcioppo Samuel and Delcioppo Del Cioppo
Bought by
Torry Dale A
Home Financials for this Owner
Home Financials are based on the most recent Mortgage that was taken out on this home.
Original Mortgage
$690,000
Interest Rate
6%
Mortgage Type
Commercial
Purchase Details
Closed on
Mar 17, 1995
Sold by
Delcioppo Samuel and Delcioppo Cynthia
Bought by
Delcioppo Samuel
Create a Home Valuation Report for This Property
The Home Valuation Report is an in-depth analysis detailing your home's value as well as a comparison with similar homes in the area
Home Values in the Area
Average Home Value in this Area
Purchase History
| Date | Buyer | Sale Price | Title Company |
|---|---|---|---|
| Ziese William J | -- | None Available | |
| Ziese William J | $1,100,000 | Orange Coast Title | |
| Torry Holdings Llc | -- | None Available | |
| Torry Dale A | $1,150,000 | Lawyers Title Company | |
| Delcioppo Samuel | -- | -- |
Source: Public Records
Mortgage History
| Date | Status | Borrower | Loan Amount |
|---|---|---|---|
| Previous Owner | Ziese William J | $650,000 | |
| Previous Owner | Torry Dale A | $690,000 |
Source: Public Records
Tax History Compared to Growth
Tax History
| Year | Tax Paid | Tax Assessment Tax Assessment Total Assessment is a certain percentage of the fair market value that is determined by local assessors to be the total taxable value of land and additions on the property. | Land | Improvement |
|---|---|---|---|---|
| 2025 | $18,414 | $1,354,560 | $689,594 | $664,966 |
| 2024 | $18,414 | $1,328,001 | $676,073 | $651,928 |
| 2023 | $18,048 | $1,301,963 | $662,817 | $639,146 |
| 2022 | $17,764 | $1,276,435 | $649,821 | $626,614 |
| 2021 | $17,478 | $1,251,408 | $637,080 | $614,328 |
| 2019 | $16,722 | $1,214,292 | $618,185 | $596,107 |
| 2018 | $15,999 | $1,190,483 | $606,064 | $584,419 |
| 2016 | $14,920 | $1,144,257 | $582,531 | $561,726 |
| 2015 | $14,701 | $1,127,070 | $573,781 | $553,289 |
| 2014 | $14,574 | $1,104,993 | $562,542 | $542,451 |
Source: Public Records
Map
Nearby Homes
- 944 Richmond Dr
- 1458 N Mountain Ave
- The Maple Plan at Descanso Walk
- The Eucalyptus Plan at Descanso Walk
- The Aspen Plan at Descanso Walk
- The Redwood Plan at Descanso Walk
- 171 Evergreen Ln
- 991 Vanderbilt Ave
- 1068 Richmond Dr
- 1080 Foothill Blvd
- 1086 Foothill Blvd
- 1090 Foothill Blvd
- 976 Butte St
- 4053 N Towne Ave
- 3611 Towne Park Cir
- 207 Colby Cir
- 540 W Baughman Ave
- 220 Babson Ct
- 1530 Finecroft Dr
- 475 E Foothill Blvd
- 849 W Foothill Blvd
- 844 Reed Dr
- 832 Reed Dr
- 876 Reed Dr
- 921 W Foothill Blvd
- 820 Reed Dr
- 888 Reed Dr
- 1401 Ashland Ave
- 816 Reed Dr
- 1400 Ashland Ave
- 910 Reed Dr
- 1400 Niagara Ave
- 935 W Foothill Blvd
- 937 W Foothill Blvd
- 937 W Foothill Blvd Unit E
- 1405 Ashland Ave
- 1401 Wells Ave
- 810 Reed Dr
- 1402 Ashland Ave
- 924 Reed Dr