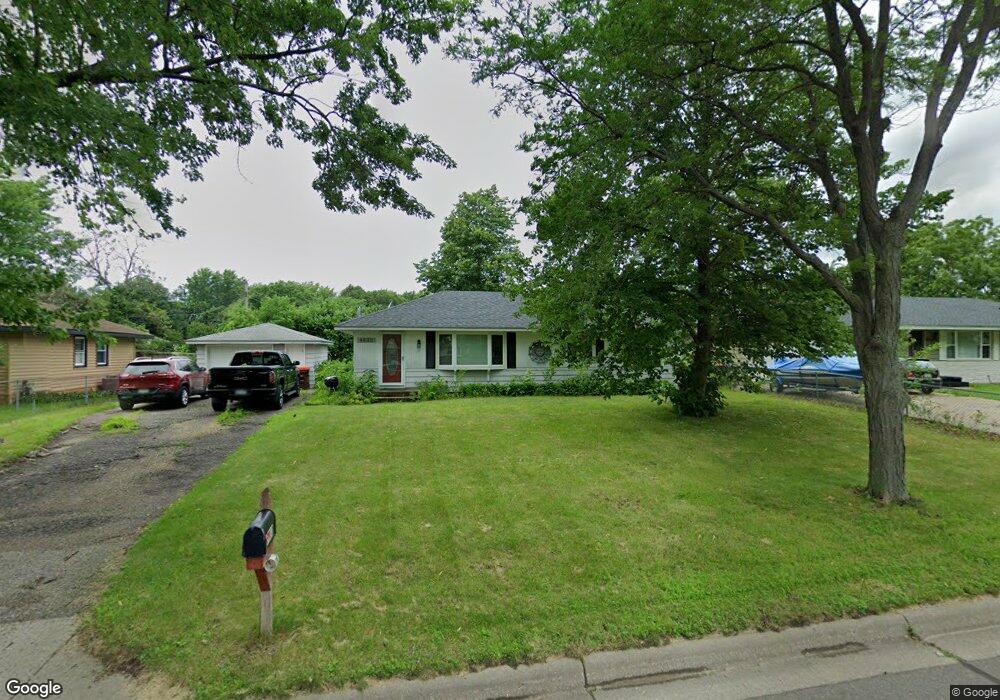
8630 Greene Ave S Cottage Grove, MN 55016
Estimated Value: $309,000 - $336,000
4
Beds
2
Baths
1,056
Sq Ft
$304/Sq Ft
Est. Value
About This Home
This home is located at 8630 Greene Ave S, Cottage Grove, MN 55016 and is currently estimated at $321,290, approximately $304 per square foot. 8630 Greene Ave S is a home located in Washington County with nearby schools including Pine Hill Elementary School, Oltman Middle School, and Park Senior High School.
Ownership History
Date
Name
Owned For
Owner Type
Purchase Details
Closed on
Nov 13, 2018
Sold by
Nunez Caupolican
Bought by
Shepersky Dustin James
Current Estimated Value
Home Financials for this Owner
Home Financials are based on the most recent Mortgage that was taken out on this home.
Original Mortgage
$227,500
Outstanding Balance
$199,632
Interest Rate
4.7%
Mortgage Type
VA
Estimated Equity
$121,658
Purchase Details
Closed on
Jun 28, 2017
Sold by
Rains Michalina Mae and Nunez Michalina Mae
Bought by
Nunez Caupolican
Purchase Details
Closed on
May 10, 2007
Sold by
Wells Fargo Bank Na
Bought by
Nunez Caupolican
Home Financials for this Owner
Home Financials are based on the most recent Mortgage that was taken out on this home.
Original Mortgage
$189,957
Interest Rate
6.5%
Mortgage Type
FHA
Purchase Details
Closed on
Feb 23, 1998
Sold by
Nielsen Daniel B and Nielsen Deborah J
Bought by
Miller Timothy D and Miller Julie A
Create a Home Valuation Report for This Property
The Home Valuation Report is an in-depth analysis detailing your home's value as well as a comparison with similar homes in the area
Home Values in the Area
Average Home Value in this Area
Purchase History
| Date | Buyer | Sale Price | Title Company |
|---|---|---|---|
| Shepersky Dustin James | $227,500 | Partners Title Llc | |
| Nunez Caupolican | -- | None Available | |
| Nunez Caupolican | $171,250 | -- | |
| Miller Timothy D | $99,000 | -- |
Source: Public Records
Mortgage History
| Date | Status | Borrower | Loan Amount |
|---|---|---|---|
| Open | Shepersky Dustin James | $227,500 | |
| Previous Owner | Nunez Caupolican | $189,957 |
Source: Public Records
Tax History Compared to Growth
Tax History
| Year | Tax Paid | Tax Assessment Tax Assessment Total Assessment is a certain percentage of the fair market value that is determined by local assessors to be the total taxable value of land and additions on the property. | Land | Improvement |
|---|---|---|---|---|
| 2024 | $3,414 | $280,000 | $100,000 | $180,000 |
| 2023 | $3,414 | $297,500 | $125,000 | $172,500 |
| 2022 | $3,008 | $275,200 | $114,500 | $160,700 |
| 2021 | $2,814 | $228,500 | $95,100 | $133,400 |
| 2020 | $2,780 | $217,500 | $90,500 | $127,000 |
| 2019 | $2,694 | $209,300 | $82,000 | $127,300 |
| 2018 | $2,732 | $199,100 | $79,000 | $120,100 |
| 2017 | $2,732 | $183,800 | $72,500 | $111,300 |
| 2016 | $2,852 | $165,100 | $55,000 | $110,100 |
| 2015 | $2,150 | $157,800 | $50,000 | $107,800 |
| 2013 | -- | $134,800 | $40,400 | $94,400 |
Source: Public Records
Map
Nearby Homes
- 8926 Granada Ave S
- 8392 Greene Ave S
- 10412 Goodview Ave S
- 8633 Grospoint Ave S
- 10508 Glenbrook Ave S
- 10502 Glenbrook Ave S
- 10406 Glenbrook Ave S
- 10442 Glenbrook Ave S
- 10503 Glenbrook Ave S
- 8832 Hadley Ave S
- 6467 82nd St S
- 1712 Selby Ave
- 8833 Hallmark Ave S
- 6935 91st Cove S
- 6776 92nd St S
- 6911 92nd St S
- 6699 93rd Alcove S
- 1601 14th Ave
- 9176 Harkness Ave S
- 1020 Gary Dr
- 8614 Greene Ave S
- 8644 Greene Ave S
- 8615 Granada Ave S
- 8601 Granada Ave S
- 8629 Granada Ave S
- 8598 Greene Ave S
- 8660 Greene Ave S
- 8629 Greene Ave S
- 8643 Greene Ave S
- 8635 Granada Ave S
- 8613 Greene Ave S
- 8582 Greene Ave S
- 8657 Greene Ave S
- 8674 Greene Ave S
- 8589 Granada Ave S
- 8599 Greene Ave S
- 8651 Granada Ave S
- 8671 Greene Ave S
- 8568 Greene Ave S
- 8646 Greenway Ave S