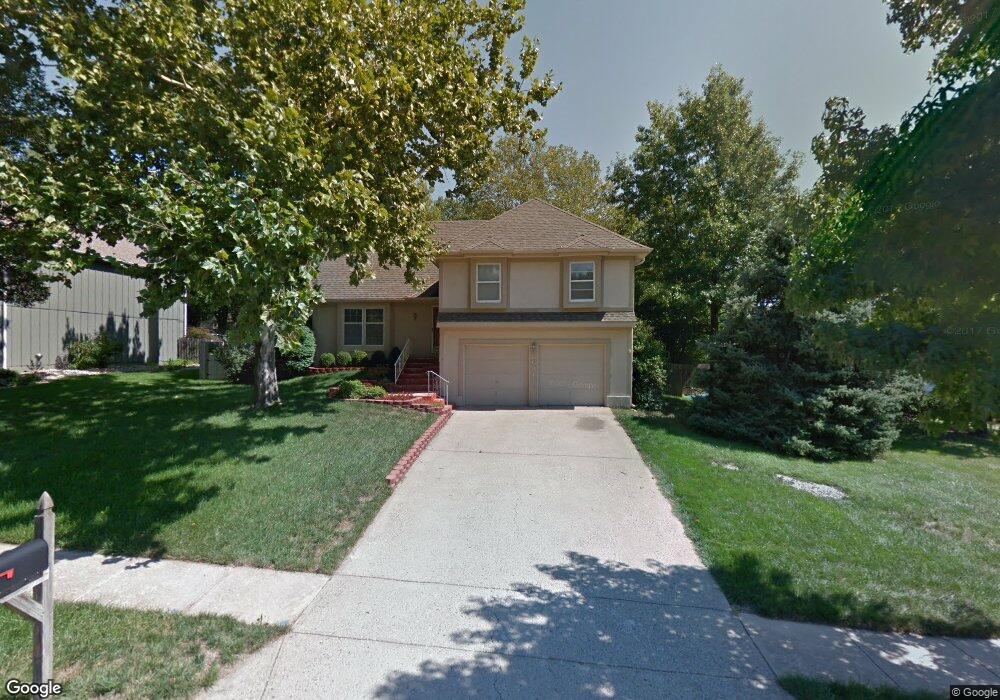
8631 Dice Ln Lenexa, KS 66215
Estimated Value: $383,364 - $426,000
4
Beds
3
Baths
1,571
Sq Ft
$256/Sq Ft
Est. Value
About This Home
This home is located at 8631 Dice Ln, Lenexa, KS 66215 and is currently estimated at $402,591, approximately $256 per square foot. 8631 Dice Ln is a home located in Johnson County with nearby schools including Rising Star Elementary School, Westridge Middle School, and Shawnee Mission West High School.
Ownership History
Date
Name
Owned For
Owner Type
Purchase Details
Closed on
Dec 26, 2015
Sold by
Griffin Chad L and Griffin Olga
Bought by
Griffin Chad L and Griffin Olga
Current Estimated Value
Purchase Details
Closed on
Oct 29, 2008
Sold by
Pearce Donald E and Pearce Belinda G
Bought by
Griffin Chad and Griffin Olga
Home Financials for this Owner
Home Financials are based on the most recent Mortgage that was taken out on this home.
Original Mortgage
$181,693
Interest Rate
6.08%
Mortgage Type
FHA
Purchase Details
Closed on
Feb 7, 2005
Sold by
Pearce Donald E and Pearce Belinda G
Bought by
Pearce Donald E
Home Financials for this Owner
Home Financials are based on the most recent Mortgage that was taken out on this home.
Original Mortgage
$181,092
Interest Rate
7.85%
Mortgage Type
Adjustable Rate Mortgage/ARM
Create a Home Valuation Report for This Property
The Home Valuation Report is an in-depth analysis detailing your home's value as well as a comparison with similar homes in the area
Home Values in the Area
Average Home Value in this Area
Purchase History
| Date | Buyer | Sale Price | Title Company |
|---|---|---|---|
| Griffin Chad L | -- | Platinum Title | |
| Griffin Chad | -- | Continental Title Company | |
| Pearce Donald E | -- | None Available |
Source: Public Records
Mortgage History
| Date | Status | Borrower | Loan Amount |
|---|---|---|---|
| Previous Owner | Griffin Chad | $181,693 | |
| Previous Owner | Pearce Donald E | $181,092 |
Source: Public Records
Tax History
| Year | Tax Paid | Tax Assessment Tax Assessment Total Assessment is a certain percentage of the fair market value that is determined by local assessors to be the total taxable value of land and additions on the property. | Land | Improvement |
|---|---|---|---|---|
| 2025 | $4,643 | $42,998 | $10,381 | $32,617 |
| 2024 | $4,643 | $42,009 | $8,650 | $33,359 |
| 2023 | $4,344 | $38,583 | $7,865 | $30,718 |
| 2022 | $4,008 | $35,558 | $7,148 | $28,410 |
| 2021 | $3,626 | $30,464 | $6,500 | $23,964 |
| 2020 | $3,481 | $28,946 | $6,500 | $22,446 |
| 2019 | $3,299 | $27,405 | $5,418 | $21,987 |
| 2018 | $3,205 | $26,381 | $5,418 | $20,963 |
| 2017 | $3,067 | $24,449 | $4,928 | $19,521 |
| 2016 | $2,896 | $22,782 | $4,483 | $18,299 |
| 2015 | $2,817 | $22,310 | $4,483 | $17,827 |
| 2013 | -- | $20,620 | $4,483 | $16,137 |
Source: Public Records
Map
Nearby Homes
- 14112 W 87th Terrace
- 8443 Alden St
- 8362 Oakview Cir
- 14621 W 89th St
- 8403 Swarner Dr
- 14640 W 90th St
- 8914 Country Hill Ct
- 14925 W 82nd Terrace
- 8740 Park St
- 8041 Acuff Ln
- 15514 W 89th St
- 8834 Candlelight Ln
- 8004 Constance St
- 8117 Woodstone St
- 8003 Mullen Rd
- 8221 Park St
- 15113 W 91st Place
- 13511 W 82nd St
- 7936 Alden St
- 9212 Constance St
Your Personal Tour Guide
Ask me questions while you tour the home.