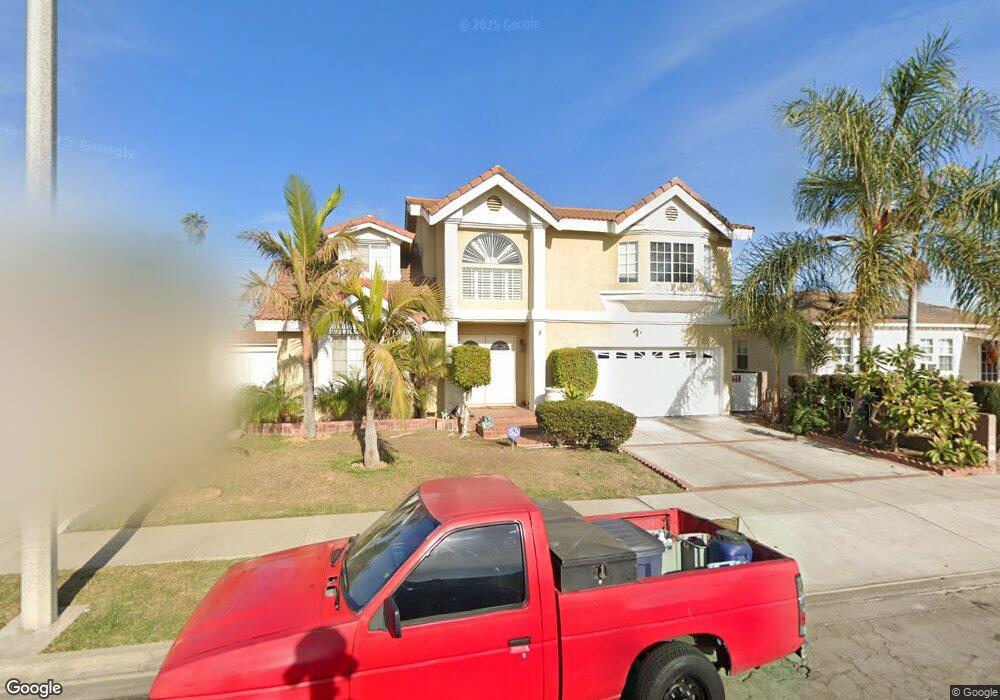
8631 Melva St Downey, CA 90242
Estimated Value: $920,000 - $1,287,000
4
Beds
3
Baths
2,110
Sq Ft
$519/Sq Ft
Est. Value
About This Home
This home is located at 8631 Melva St, Downey, CA 90242 and is currently estimated at $1,094,402, approximately $518 per square foot. 8631 Melva St is a home located in Los Angeles County with nearby schools including Alameda Elementary School, Carpenter Elementary School, and Sussman Middle School.
Ownership History
Date
Name
Owned For
Owner Type
Purchase Details
Closed on
Oct 20, 2009
Sold by
Wells Fargo Bank Na
Bought by
Wells Fargo Bank Na and Sergio Navarro Special Needs Trust
Current Estimated Value
Purchase Details
Closed on
Sep 3, 2009
Sold by
2005 Ramos Family Trust
Bought by
Wells Fargo Bank Na
Purchase Details
Closed on
Nov 21, 2005
Sold by
Ramos Angel L and Ramos Antonia T
Bought by
Ramos Angel L
Purchase Details
Closed on
May 3, 2001
Sold by
Ramos Angel and Ramos Antonia
Bought by
Ramos Angel L
Home Financials for this Owner
Home Financials are based on the most recent Mortgage that was taken out on this home.
Original Mortgage
$250,000
Interest Rate
7.03%
Purchase Details
Closed on
Mar 14, 1996
Sold by
Valladares Manuel
Bought by
Ramos Angel L and Ramos Antonia T
Home Financials for this Owner
Home Financials are based on the most recent Mortgage that was taken out on this home.
Original Mortgage
$241,200
Interest Rate
7.84%
Create a Home Valuation Report for This Property
The Home Valuation Report is an in-depth analysis detailing your home's value as well as a comparison with similar homes in the area
Home Values in the Area
Average Home Value in this Area
Purchase History
| Date | Buyer | Sale Price | Title Company |
|---|---|---|---|
| Wells Fargo Bank Na | -- | Chicago Title Company | |
| Wells Fargo Bank Na | $565,000 | Chicago Title Company | |
| Ramos Angel L | -- | -- | |
| Ramos Angel L | -- | -- | |
| Ramos Angel L | -- | Chicago Title Co | |
| Ramos Angel L | $268,181 | Orange Coast Title |
Source: Public Records
Mortgage History
| Date | Status | Borrower | Loan Amount |
|---|---|---|---|
| Previous Owner | Ramos Angel L | $250,000 | |
| Previous Owner | Ramos Angel L | $241,200 |
Source: Public Records
Tax History Compared to Growth
Tax History
| Year | Tax Paid | Tax Assessment Tax Assessment Total Assessment is a certain percentage of the fair market value that is determined by local assessors to be the total taxable value of land and additions on the property. | Land | Improvement |
|---|---|---|---|---|
| 2025 | $7,051 | $555,037 | $296,882 | $258,155 |
| 2024 | $7,051 | $544,155 | $291,061 | $253,094 |
| 2023 | $6,813 | $533,486 | $285,354 | $248,132 |
| 2022 | $6,473 | $523,026 | $279,759 | $243,267 |
| 2021 | $6,330 | $512,772 | $274,274 | $238,498 |
| 2019 | $6,168 | $497,565 | $266,140 | $231,425 |
| 2018 | $5,990 | $487,810 | $260,922 | $226,888 |
| 2016 | $5,805 | $468,870 | $250,791 | $218,079 |
| 2015 | $5,723 | $461,828 | $247,024 | $214,804 |
| 2014 | $5,400 | $452,783 | $242,186 | $210,597 |
Source: Public Records
Map
Nearby Homes
- 8558 Alameda St
- 12152 Marbel Ave
- 12148 Marbel Ave
- 12014 Patton Rd
- 8426 Orange St
- 0 Orange St
- 12143 Downey Ave
- 12566 Brookshire Ave
- 12566 Dolan Ave
- 12124 Anderberg Ave
- 12707 Glenshire Rd
- 8509 Cleta St
- 11702 Corrigan Ave
- 12350 Brock Ave
- 12843 Columbia Way
- 11816 La Reina Ave
- 12614 Gneiss Ave
- 9317 Elm Vista Dr Unit 9
- 12917 Sandy Ln
- 8231 Comolette St