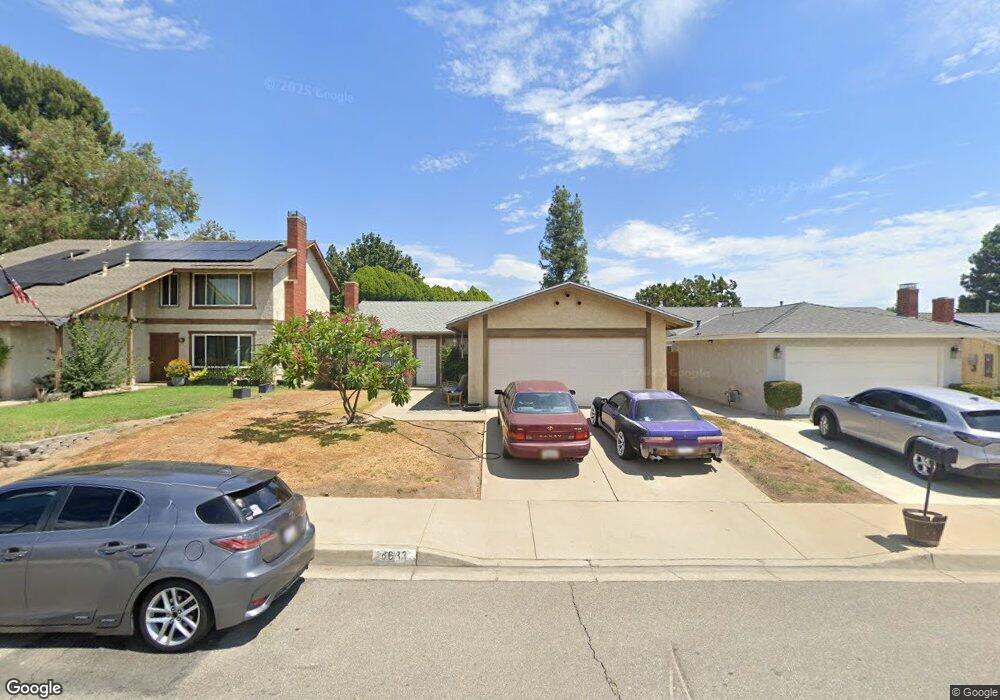
8633 Willow Dr Rancho Cucamonga, CA 91730
Estimated Value: $618,000 - $684,000
3
Beds
2
Baths
1,240
Sq Ft
$519/Sq Ft
Est. Value
About This Home
This home is located at 8633 Willow Dr, Rancho Cucamonga, CA 91730 and is currently estimated at $643,996, approximately $519 per square foot. 8633 Willow Dr is a home located in San Bernardino County with nearby schools including Cucamonga Elementary, Rancho Cucamonga Middle, and Chaffey High School.
Ownership History
Date
Name
Owned For
Owner Type
Purchase Details
Closed on
Jan 26, 2017
Sold by
Lyle Lilia
Bought by
Lyle Morley A T and Lyle Lilia M
Current Estimated Value
Purchase Details
Closed on
Jan 2, 2017
Sold by
Lyle Morley A T
Bought by
Lyle Morley A T and Lyle Lilia M
Purchase Details
Closed on
Feb 27, 2014
Sold by
Lyle Morely A
Bought by
Lyle Lilia
Home Financials for this Owner
Home Financials are based on the most recent Mortgage that was taken out on this home.
Original Mortgage
$200,000
Outstanding Balance
$151,593
Interest Rate
4.34%
Mortgage Type
New Conventional
Estimated Equity
$492,403
Purchase Details
Closed on
Aug 12, 2011
Sold by
Trombly Patricia Claire
Bought by
Lyle Lilia
Purchase Details
Closed on
Jul 20, 2011
Sold by
Thieman Annie
Bought by
Metz William E
Purchase Details
Closed on
Jul 18, 2011
Sold by
Trombly Richard Daulton
Bought by
Trombly Patricia Claire
Create a Home Valuation Report for This Property
The Home Valuation Report is an in-depth analysis detailing your home's value as well as a comparison with similar homes in the area
Home Values in the Area
Average Home Value in this Area
Purchase History
| Date | Buyer | Sale Price | Title Company |
|---|---|---|---|
| Lyle Morley A T | -- | None Available | |
| Lyle Morley A T | -- | None Available | |
| Lyle Lilia | -- | Spl Title Services | |
| Lyle Lilia | $175,000 | Chicago Title Company | |
| Metz William E | -- | Chicago Title Company | |
| Trombly Patricia Claire | -- | Chicago Title Company |
Source: Public Records
Mortgage History
| Date | Status | Borrower | Loan Amount |
|---|---|---|---|
| Open | Lyle Lilia | $200,000 |
Source: Public Records
Tax History Compared to Growth
Tax History
| Year | Tax Paid | Tax Assessment Tax Assessment Total Assessment is a certain percentage of the fair market value that is determined by local assessors to be the total taxable value of land and additions on the property. | Land | Improvement |
|---|---|---|---|---|
| 2025 | $2,315 | $219,813 | $76,935 | $142,878 |
| 2024 | $2,315 | $215,502 | $75,426 | $140,076 |
| 2023 | $2,262 | $211,276 | $73,947 | $137,329 |
| 2022 | $2,221 | $207,133 | $72,497 | $134,636 |
| 2021 | $2,202 | $203,071 | $71,075 | $131,996 |
| 2020 | $2,163 | $200,989 | $70,346 | $130,643 |
| 2019 | $2,152 | $197,048 | $68,967 | $128,081 |
| 2018 | $2,098 | $193,185 | $67,615 | $125,570 |
| 2017 | $2,022 | $189,397 | $66,289 | $123,108 |
| 2016 | $1,996 | $185,683 | $64,989 | $120,694 |
| 2015 | $1,983 | $182,894 | $64,013 | $118,881 |
| 2014 | $1,923 | $179,311 | $62,759 | $116,552 |
Source: Public Records
Map
Nearby Homes
- 8530 Willow Dr
- 10108 24th St
- 8430 Spring Desert Place Unit B
- 8426 Western Trail Place Unit E
- 10215 25th St
- 8541 Creekside Place
- 8401 Sunset Trail Place Unit E
- 10312 24th St
- 10312 Sparkling Dr Unit 3
- 10326 Sparkling Dr Unit 1
- 10322 24th St
- 10349 Cooks Dr Unit 2
- 10382 Sparkling Dr Unit 1
- 8541 Oak Barrel Place
- 9448 Calle Vejar
- 10026 10026 Foothill Blvd
- 1 Hoffman Rd
- 9175 Jadeite Ave
- 8252 Malachite Ave
- 9372 Calle Vejar