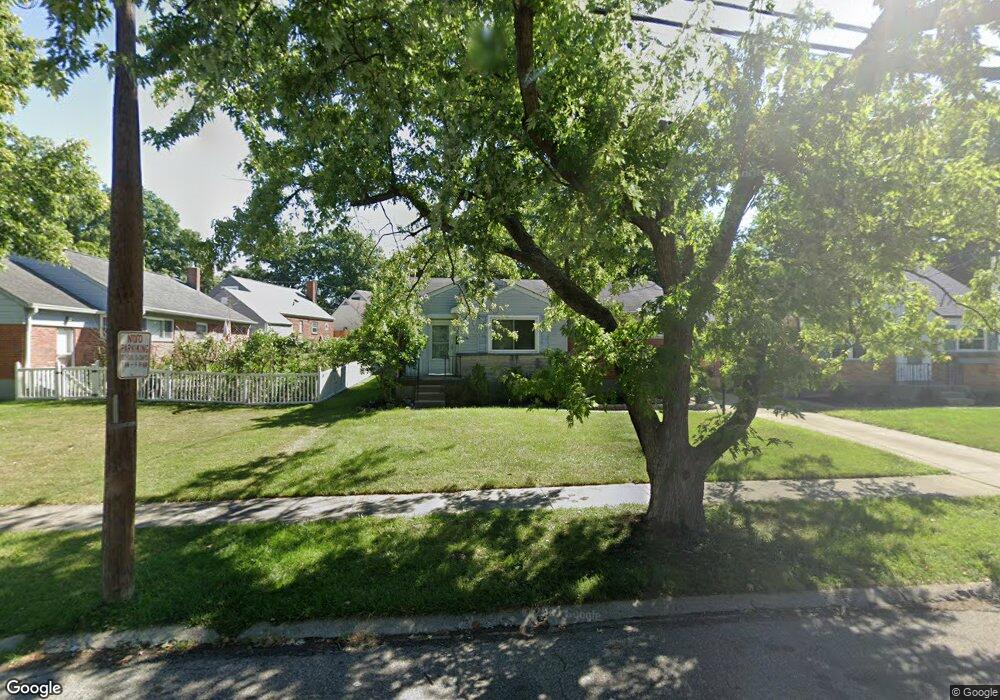
8634 Mockingbird Ln Cincinnati, OH 45231
Finneytown NeighborhoodEstimated Value: $202,000 - $217,307
3
Beds
2
Baths
1,726
Sq Ft
$121/Sq Ft
Est. Value
About This Home
This home is located at 8634 Mockingbird Ln, Cincinnati, OH 45231 and is currently estimated at $208,077, approximately $120 per square foot. 8634 Mockingbird Ln is a home located in Hamilton County with nearby schools including Finneytown Elementary School, Finneytown Secondary Campus, and St. Vivian School.
Ownership History
Date
Name
Owned For
Owner Type
Purchase Details
Closed on
Jun 3, 2009
Sold by
Kask Isaac D and Kask Leslie A
Bought by
Weitlauf Sheila
Current Estimated Value
Purchase Details
Closed on
Dec 29, 2003
Sold by
Reinhart Cheryl M
Bought by
Kask Isaac D and Kask Leslie A
Home Financials for this Owner
Home Financials are based on the most recent Mortgage that was taken out on this home.
Original Mortgage
$120,935
Interest Rate
4.62%
Mortgage Type
Unknown
Purchase Details
Closed on
Jun 7, 2000
Sold by
Martha Smith
Bought by
Reinhart Cheryl M
Home Financials for this Owner
Home Financials are based on the most recent Mortgage that was taken out on this home.
Original Mortgage
$88,000
Interest Rate
8.25%
Create a Home Valuation Report for This Property
The Home Valuation Report is an in-depth analysis detailing your home's value as well as a comparison with similar homes in the area
Home Values in the Area
Average Home Value in this Area
Purchase History
| Date | Buyer | Sale Price | Title Company |
|---|---|---|---|
| Weitlauf Sheila | $50,000 | Attorney | |
| Kask Isaac D | $120,000 | Huntington Title Services | |
| Reinhart Cheryl M | $110,000 | -- |
Source: Public Records
Mortgage History
| Date | Status | Borrower | Loan Amount |
|---|---|---|---|
| Previous Owner | Kask Isaac D | $120,935 | |
| Previous Owner | Reinhart Cheryl M | $88,000 |
Source: Public Records
Tax History
| Year | Tax Paid | Tax Assessment Tax Assessment Total Assessment is a certain percentage of the fair market value that is determined by local assessors to be the total taxable value of land and additions on the property. | Land | Improvement |
|---|---|---|---|---|
| 2025 | $3,649 | $50,831 | $9,048 | $41,783 |
| 2024 | $3,662 | $50,831 | $9,048 | $41,783 |
| 2023 | $3,539 | $50,831 | $9,048 | $41,783 |
| 2022 | $2,976 | $31,053 | $8,929 | $22,124 |
| 2021 | $2,981 | $31,053 | $8,929 | $22,124 |
| 2020 | $2,953 | $31,053 | $8,929 | $22,124 |
| 2019 | $2,732 | $26,317 | $7,567 | $18,750 |
| 2018 | $2,528 | $26,317 | $7,567 | $18,750 |
| 2017 | $2,447 | $26,317 | $7,567 | $18,750 |
| 2016 | $1,597 | $16,629 | $7,816 | $8,813 |
| 2015 | $1,582 | $16,629 | $7,816 | $8,813 |
| 2014 | $1,580 | $16,629 | $7,816 | $8,813 |
| 2013 | $1,609 | $17,500 | $8,225 | $9,275 |
Source: Public Records
Map
Nearby Homes
- 8628 Mockingbird Ln
- 1055 Hempstead Dr
- 1116 Madeleine Cir
- 1144 Hempstead Dr
- 8754 Monsanto Dr
- 8829 Mockingbird Ln
- 958 Hollytree Dr
- 1101 Meadowind Ct
- 1006 Hearthstone Dr
- 8943 Monsanto Dr
- 9137 Fontainebleau Terrace
- 881 Sabino Ct
- 1297 Landis Ln
- 8719 Hood Ct
- 1123 Compton Rd
- 1115 Compton Rd
- 1165 W Galbraith Rd
- 8771 Desoto Dr
- 816 Sabino Ct
- 7352 Clovernook Ave
- 1067 Vacationland Dr
- 1061 Vacationland Dr
- 1055 Vacationland Dr
- 1051 Vacationland Dr
- 8633 Mockingbird Ln
- 8616 Mockingbird Ln
- 1047 Vacationland Dr
- 8637 Mockingbird Ln
- 8643 Mockingbird Ln
- 1043 Vacationland Dr
- 1070 Vacationland Dr
- 8647 Mockingbird Ln
- 1064 Hempstead Dr
- 1064 Vacationland Dr
- 1058 Hempstead Dr
- 1076 Hempstead Dr
- 1060 Vacationland Dr
- 1056 Vacationland Dr
- 1039 Vacationland Dr
- 1048 Vacationland Dr
Your Personal Tour Guide
Ask me questions while you tour the home.