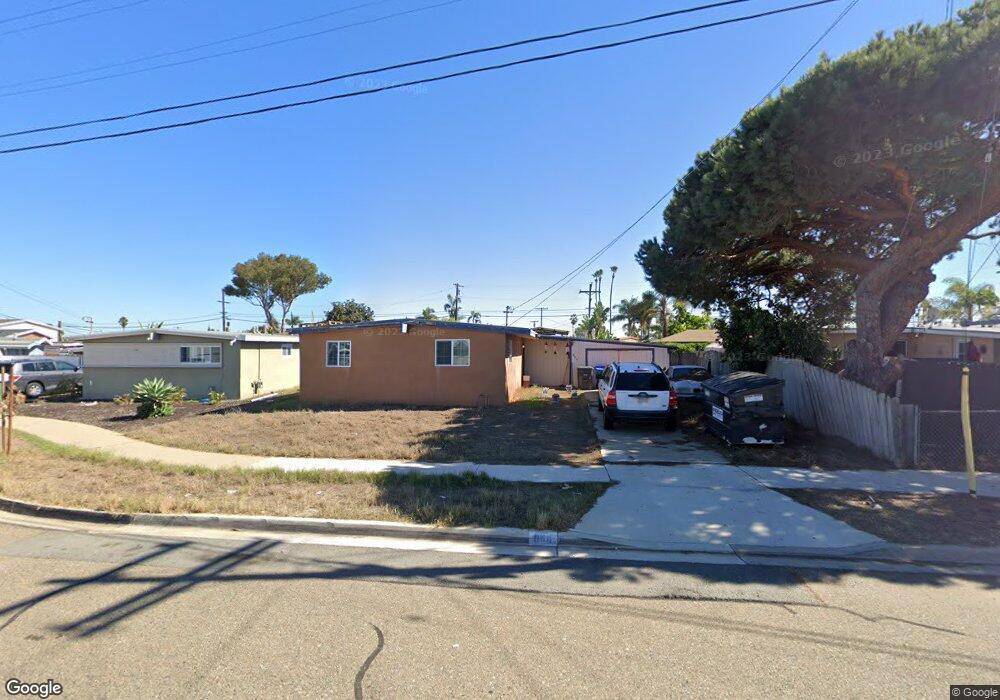
864 Hickory Ct Imperial Beach, CA 91932
Estimated Value: $785,000 - $821,000
3
Beds
2
Baths
1,008
Sq Ft
$799/Sq Ft
Est. Value
About This Home
This home is located at 864 Hickory Ct, Imperial Beach, CA 91932 and is currently estimated at $805,437, approximately $799 per square foot. 864 Hickory Ct is a home located in San Diego County with nearby schools including Oneonta Elementary School, Mar Vista Academy, and Mar Vista Senior High School.
Ownership History
Date
Name
Owned For
Owner Type
Purchase Details
Closed on
Jan 9, 2015
Sold by
Wight Dick C
Bought by
D Wight Properties Llc
Current Estimated Value
Purchase Details
Closed on
Feb 21, 2001
Sold by
Naranjo Juan
Bought by
Wight Dick C
Home Financials for this Owner
Home Financials are based on the most recent Mortgage that was taken out on this home.
Original Mortgage
$100,000
Interest Rate
7.09%
Purchase Details
Closed on
Mar 16, 1995
Sold by
Colon Maria A
Bought by
Naranjo Juan
Home Financials for this Owner
Home Financials are based on the most recent Mortgage that was taken out on this home.
Original Mortgage
$124,080
Interest Rate
8.9%
Mortgage Type
FHA
Purchase Details
Closed on
Jun 22, 1994
Sold by
Wight Dick C
Bought by
Colon Maria A
Purchase Details
Closed on
Sep 30, 1987
Create a Home Valuation Report for This Property
The Home Valuation Report is an in-depth analysis detailing your home's value as well as a comparison with similar homes in the area
Home Values in the Area
Average Home Value in this Area
Purchase History
| Date | Buyer | Sale Price | Title Company |
|---|---|---|---|
| D Wight Properties Llc | -- | None Available | |
| Wight Dick C | $125,000 | Benefit Land Title Company | |
| Naranjo Juan | $125,000 | Orange Coast Title Company | |
| Colon Maria A | -- | -- | |
| -- | $90,000 | -- |
Source: Public Records
Mortgage History
| Date | Status | Borrower | Loan Amount |
|---|---|---|---|
| Previous Owner | Wight Dick C | $100,000 | |
| Previous Owner | Naranjo Juan | $124,080 | |
| Closed | Wight Dick C | $25,000 |
Source: Public Records
Tax History Compared to Growth
Tax History
| Year | Tax Paid | Tax Assessment Tax Assessment Total Assessment is a certain percentage of the fair market value that is determined by local assessors to be the total taxable value of land and additions on the property. | Land | Improvement |
|---|---|---|---|---|
| 2025 | $13,020 | $263,675 | $128,073 | $135,602 |
| 2024 | $13,020 | $258,506 | $125,562 | $132,944 |
| 2023 | $3,502 | $253,438 | $123,100 | $130,338 |
| 2022 | $3,294 | $248,470 | $120,687 | $127,783 |
| 2021 | $3,441 | $243,599 | $118,321 | $125,278 |
| 2020 | $3,139 | $241,102 | $117,108 | $123,994 |
| 2019 | $3,119 | $236,375 | $114,812 | $121,563 |
| 2018 | $3,097 | $231,741 | $112,561 | $119,180 |
| 2017 | $3,117 | $227,198 | $110,354 | $116,844 |
| 2016 | $3,381 | $222,744 | $108,191 | $114,553 |
| 2015 | $3,307 | $219,399 | $106,566 | $112,833 |
| 2014 | $3,192 | $215,102 | $104,479 | $110,623 |
Source: Public Records
Map
Nearby Homes
- 1236 Emory St
- 1250 8th St
- 1211 9th St
- 1226 8th St
- 718 Oneonta Ave
- 743 Iris Ave
- 1149, 1149-2 Connecticut St
- 1149 Connecticut St
- 1150-76 11th St
- 1059 Emory St
- 1133 11th St
- 765 Elkwood Ave
- 1249 12th St
- 1055 11th St
- 1038 Delaware St
- 1223 12th St
- 1016 Delaware St
- 981-83 Elder Ave
- 1274 Holly Ave
- 1282-86 13th St