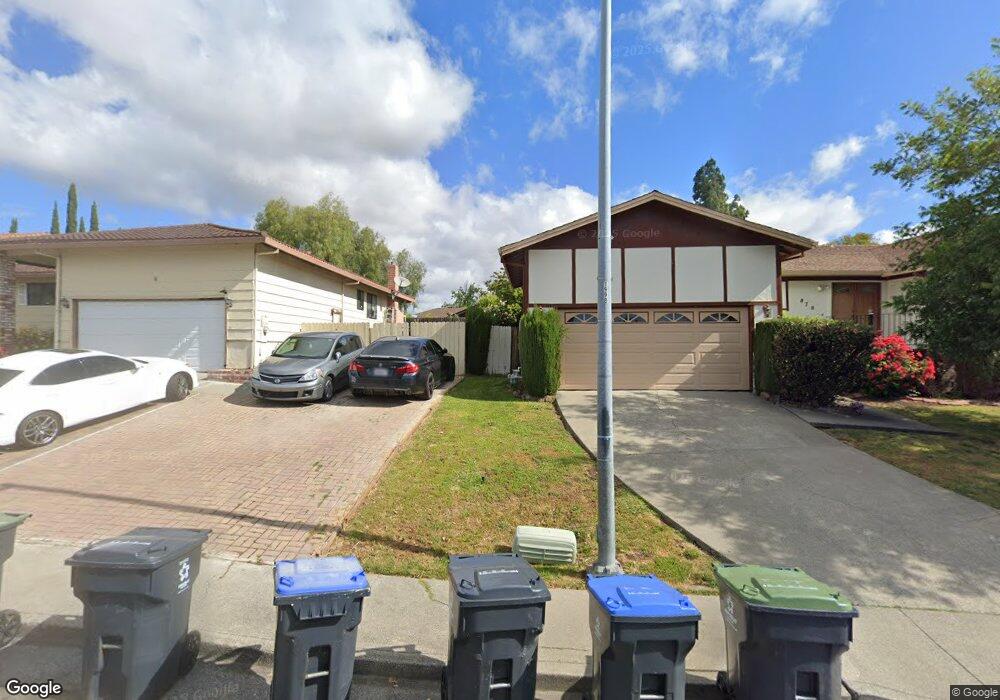
864 Tabor Ave Fairfield, CA 94533
Estimated Value: $540,000 - $613,000
3
Beds
2
Baths
1,916
Sq Ft
$305/Sq Ft
Est. Value
About This Home
This home is located at 864 Tabor Ave, Fairfield, CA 94533 and is currently estimated at $584,432, approximately $305 per square foot. 864 Tabor Ave is a home located in Solano County with nearby schools including David Weir Preparatory Academy, Grange Middle School, and Fairfield High School.
Ownership History
Date
Name
Owned For
Owner Type
Purchase Details
Closed on
Apr 5, 2010
Sold by
Humpheys Michael Scott and Brandenburg Julie Kathleen
Bought by
Dumlao Anthony D and Dumlao Tracy R
Current Estimated Value
Home Financials for this Owner
Home Financials are based on the most recent Mortgage that was taken out on this home.
Original Mortgage
$304,735
Outstanding Balance
$202,460
Interest Rate
4.95%
Mortgage Type
VA
Estimated Equity
$381,972
Purchase Details
Closed on
Mar 24, 2003
Sold by
Humphreys Frank E and Humphreys Johny B
Bought by
Humphreys Frank E and Humphreys Johny B
Purchase Details
Closed on
Nov 14, 2002
Sold by
Humphreys Frank E and Humphreys Johny B
Bought by
Humphreys Frank E and Humphreys Johny B
Home Financials for this Owner
Home Financials are based on the most recent Mortgage that was taken out on this home.
Original Mortgage
$159,500
Interest Rate
5.89%
Create a Home Valuation Report for This Property
The Home Valuation Report is an in-depth analysis detailing your home's value as well as a comparison with similar homes in the area
Home Values in the Area
Average Home Value in this Area
Purchase History
| Date | Buyer | Sale Price | Title Company |
|---|---|---|---|
| Dumlao Anthony D | $295,000 | First American Title Company | |
| Humphreys Frank E | -- | -- | |
| Humphreys Frank E | -- | Fidelity Title Company |
Source: Public Records
Mortgage History
| Date | Status | Borrower | Loan Amount |
|---|---|---|---|
| Open | Dumlao Anthony D | $304,735 | |
| Previous Owner | Humphreys Frank E | $159,500 |
Source: Public Records
Tax History Compared to Growth
Tax History
| Year | Tax Paid | Tax Assessment Tax Assessment Total Assessment is a certain percentage of the fair market value that is determined by local assessors to be the total taxable value of land and additions on the property. | Land | Improvement |
|---|---|---|---|---|
| 2025 | $4,181 | $380,784 | $64,537 | $316,247 |
| 2024 | $4,181 | $373,319 | $63,272 | $310,047 |
| 2023 | $4,051 | $366,000 | $62,032 | $303,968 |
| 2022 | $4,000 | $358,824 | $60,816 | $298,008 |
| 2021 | $3,959 | $351,789 | $59,624 | $292,165 |
| 2020 | $3,866 | $348,183 | $59,013 | $289,170 |
| 2019 | $3,769 | $341,356 | $57,856 | $283,500 |
| 2018 | $3,889 | $334,664 | $56,722 | $277,942 |
| 2017 | $3,708 | $328,103 | $55,610 | $272,493 |
| 2016 | $3,678 | $321,670 | $54,520 | $267,150 |
| 2015 | $3,432 | $316,840 | $53,702 | $263,138 |
| 2014 | $3,400 | $310,635 | $52,651 | $257,984 |
Source: Public Records
Map
Nearby Homes
- 799 Tabor Ave
- 751 Hillcrest Ct
- 954 Coventry Ln
- 937 Pacific Ave
- 2256 Dorset Ln
- 2207 Cunningham Dr
- 2284 Wiltshire Ct
- 2289 Rutland Ct
- 1301 Sunningdale Ln
- Bryce Plan at Brighton Place
- Cora Plan at Brighton Place
- 1305 Sunningdale Ln
- 1309 Sunningdale Ln
- 1300 Sunningdale Ln
- 1661 Fairfield Ave
- 1308 Sunningdale Ln
- 1331 Canterbury Dr
- 1831 Clay St
- 74 Anza Ct
- 81 Del Prado Cir