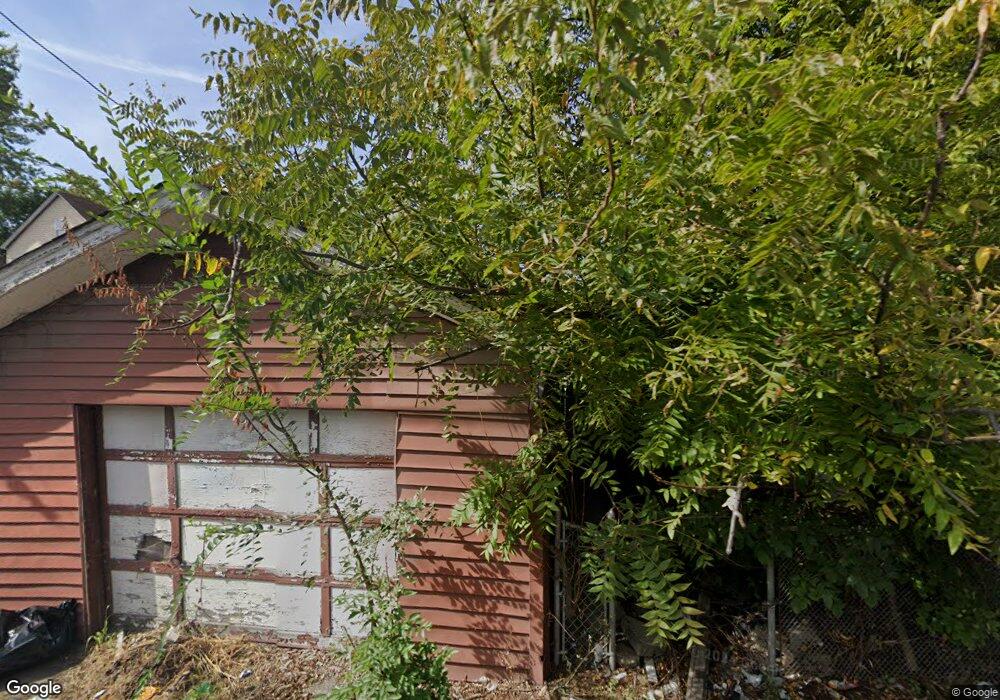
8641 S Manistee Ave Chicago, IL 60617
South Chicago NeighborhoodEstimated Value: $99,229 - $153,000
2
Beds
1
Bath
1,080
Sq Ft
$113/Sq Ft
Est. Value
About This Home
This home is located at 8641 S Manistee Ave, Chicago, IL 60617 and is currently estimated at $122,307, approximately $113 per square foot. 8641 S Manistee Ave is a home located in Cook County with nearby schools including Arnold Mireles Academy, Great Lakes Academy, and Noble - Baker College Preparatory High School.
Ownership History
Date
Name
Owned For
Owner Type
Purchase Details
Closed on
Aug 25, 2016
Sold by
Burns Lee
Bought by
Rowden Margaret and Ebkridge Cleaveni
Current Estimated Value
Purchase Details
Closed on
Dec 14, 1998
Sold by
Burns Lee
Bought by
Burns Lee and Burns Jo Ann
Home Financials for this Owner
Home Financials are based on the most recent Mortgage that was taken out on this home.
Original Mortgage
$60,000
Interest Rate
6.96%
Purchase Details
Closed on
Mar 27, 1997
Sold by
American National Bk & Tr Co Of Chicago
Bought by
Burns Lee
Home Financials for this Owner
Home Financials are based on the most recent Mortgage that was taken out on this home.
Original Mortgage
$59,200
Interest Rate
10.12%
Purchase Details
Closed on
Oct 23, 1996
Sold by
Wright Whestone Margie and Whetstone Margie A
Bought by
American National Bk & Tr Co Of Chicago and Trust #119859-00
Create a Home Valuation Report for This Property
The Home Valuation Report is an in-depth analysis detailing your home's value as well as a comparison with similar homes in the area
Home Values in the Area
Average Home Value in this Area
Purchase History
| Date | Buyer | Sale Price | Title Company |
|---|---|---|---|
| Rowden Margaret | -- | None Available | |
| Burns Lee | -- | Lawyers Title Insurance Corp | |
| Burns Lee | $74,000 | -- | |
| American National Bk & Tr Co Of Chicago | $35,500 | Attorneys Natl Title Network |
Source: Public Records
Mortgage History
| Date | Status | Borrower | Loan Amount |
|---|---|---|---|
| Previous Owner | Burns Lee | $60,000 | |
| Previous Owner | Burns Lee | $59,200 | |
| Closed | Burns Lee | $20,125 |
Source: Public Records
Tax History Compared to Growth
Tax History
| Year | Tax Paid | Tax Assessment Tax Assessment Total Assessment is a certain percentage of the fair market value that is determined by local assessors to be the total taxable value of land and additions on the property. | Land | Improvement |
|---|---|---|---|---|
| 2024 | $461 | $6,300 | $3,750 | $2,550 |
| 2023 | $428 | $5,500 | $3,125 | $2,375 |
| 2022 | $428 | $5,500 | $3,125 | $2,375 |
| 2021 | $436 | $5,500 | $3,125 | $2,375 |
| 2020 | $1,157 | $8,294 | $3,125 | $5,169 |
| 2019 | $1,163 | $9,216 | $3,125 | $6,091 |
| 2018 | $1,142 | $9,216 | $3,125 | $6,091 |
| 2017 | $1,461 | $10,164 | $2,812 | $7,352 |
| 2016 | $1,536 | $10,164 | $2,812 | $7,352 |
| 2015 | $1,382 | $10,164 | $2,812 | $7,352 |
| 2014 | $1,198 | $9,028 | $2,187 | $6,841 |
| 2013 | $1,164 | $9,028 | $2,187 | $6,841 |
Source: Public Records
Map
Nearby Homes
- 8623 S Manistee Ave
- 8639 S Burnham Ave
- 8705 S Marquette Ave
- 8551 S Manistee Ave
- 8716 S Marquette Ave
- 8600 S Muskegon Ave
- 8548 S Marquette Ave
- 8638 S Escanaba Ave
- 2900 E 87th St
- 8512 S Manistee Ave
- 8533 S Muskegon Ave
- 8647 S Colfax Ave
- 8518 S Marquette Ave
- 8613 S Colfax Ave
- 8459 S Manistee Ave
- 8527 S Colfax Ave
- 8548 S Exchange Ave
- 8500 S Escanaba Ave
- 8548 S Colfax Ave
- 8643 S Kingston Ave
- 8643 S Manistee Ave
- 8639 S Manistee Ave
- 8645 S Manistee Ave
- 8635 S Manistee Ave
- 8635 S Manistee Ave
- 8647 S Manistee Ave Unit 1
- 8631 S Manistee Ave
- 8649 S Manistee Ave
- 8627 S Manistee Ave
- 8650 S Burnham Ave
- 8642 S Burnham Ave
- 8636 S Burnham Ave
- 8644 S Burnham Ave
- 8634 S Burnham Ave
- 8646 S Burnham Ave
- 8625 S Manistee Ave Unit 1
- 8638 S Burnham Ave Unit 1
- 8628 S Burnham Ave
- 8657 S Manistee Ave Unit 2
- 8657 S Manistee Ave Unit 1F