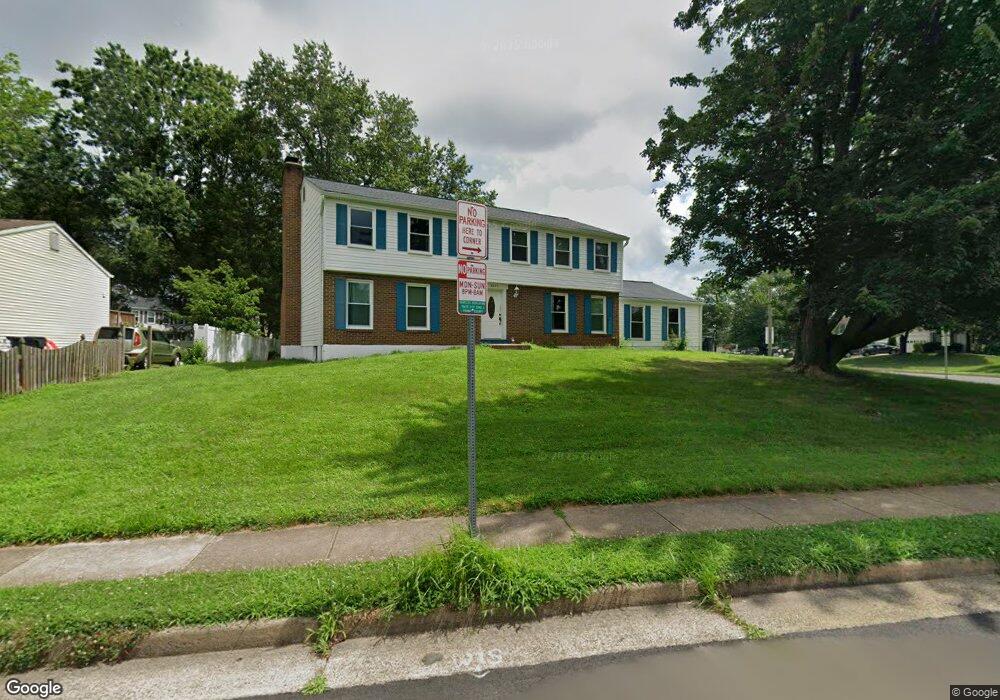
8641 Weems Rd Manassas, VA 20110
Estimated Value: $626,565 - $664,000
5
Beds
3
Baths
2,376
Sq Ft
$270/Sq Ft
Est. Value
About This Home
This home is located at 8641 Weems Rd, Manassas, VA 20110 and is currently estimated at $642,641, approximately $270 per square foot. 8641 Weems Rd is a home located in Manassas City with nearby schools including Weems Elementary School, Mayfield Intermediate School, and Grace E. Metz Middle School.
Ownership History
Date
Name
Owned For
Owner Type
Purchase Details
Closed on
Dec 15, 2016
Sold by
Conrad Susannah L
Bought by
Conrad David B and Conrad Susannah L
Current Estimated Value
Purchase Details
Closed on
Sep 17, 2010
Sold by
United States Of America
Bought by
Walton Susannah L
Home Financials for this Owner
Home Financials are based on the most recent Mortgage that was taken out on this home.
Original Mortgage
$246,578
Outstanding Balance
$163,318
Interest Rate
4.5%
Mortgage Type
FHA
Estimated Equity
$479,323
Purchase Details
Closed on
Mar 3, 2005
Sold by
Hoban Joseph Patrick
Bought by
Deardorff Keith A
Home Financials for this Owner
Home Financials are based on the most recent Mortgage that was taken out on this home.
Original Mortgage
$359,650
Interest Rate
5.66%
Mortgage Type
New Conventional
Create a Home Valuation Report for This Property
The Home Valuation Report is an in-depth analysis detailing your home's value as well as a comparison with similar homes in the area
Home Values in the Area
Average Home Value in this Area
Purchase History
| Date | Buyer | Sale Price | Title Company |
|---|---|---|---|
| Conrad David B | -- | None Available | |
| Walton Susannah L | $249,900 | None Available | |
| United States Of America | $434,008 | None Available | |
| Deardorff Keith A | $449,579 | -- |
Source: Public Records
Mortgage History
| Date | Status | Borrower | Loan Amount |
|---|---|---|---|
| Open | Walton Susannah L | $246,578 | |
| Previous Owner | Deardorff Keith A | $359,650 |
Source: Public Records
Tax History Compared to Growth
Tax History
| Year | Tax Paid | Tax Assessment Tax Assessment Total Assessment is a certain percentage of the fair market value that is determined by local assessors to be the total taxable value of land and additions on the property. | Land | Improvement |
|---|---|---|---|---|
| 2024 | $6,959 | $552,300 | $167,000 | $385,300 |
| 2023 | $6,859 | $544,400 | $162,000 | $382,400 |
| 2022 | $6,659 | $496,200 | $141,000 | $355,200 |
| 2021 | $6,106 | $427,300 | $126,000 | $301,300 |
| 2020 | $5,764 | $394,800 | $121,500 | $273,300 |
| 2019 | $5,689 | $384,400 | $118,000 | $266,400 |
| 2018 | $5,592 | $383,000 | $112,500 | $270,500 |
| 2017 | -- | $375,700 | $112,500 | $263,200 |
| 2016 | $5,019 | $357,700 | $0 | $0 |
| 2015 | -- | $323,900 | $112,500 | $211,400 |
| 2014 | -- | $0 | $0 | $0 |
Source: Public Records
Map
Nearby Homes
- 8610 Lamont Ct
- 8572 King Carter St
- 8516 Cavalry Ln
- 9022 New Britain Cir
- 8494 Kirby St
- 8584 Liberia Ave
- 9188 Laurelwood Ct
- 9058 Old Hickory Ct
- 8751 Weir St
- 9256 Stonewall Ct
- 8396 Woodline Ct
- 8600 Stonewall Rd
- 167 Scott Dr
- 9019 Sudley Rd
- 185 Cabbel Dr
- 8347 Ivy Glen Ct
- 8357 Tillett Loop
- 132 Evans St
- 8341 Tillett Loop
- 135 Polk Dr
- 8639 Weems Rd
- 8902 Caribou Ln
- 8905 Caribou Ln
- 8637 Weems Rd
- 8904 Caribou Ln
- 8903 Caribou Ln
- 8650 Liberia Ave
- 8652 Liberia Ave
- 8635 Weems Rd
- 8721 Weems Rd
- 8648 Liberia Ave
- 8901 Caribou Ln
- 8646 Liberia Ave
- 8656 Liberia Ave
- 8633 Weems Rd
- 8909 Traveller St
- 8723 Weems Rd
- 8907 Traveller St
- Carlton Dr
- 8644 Liberia Ave