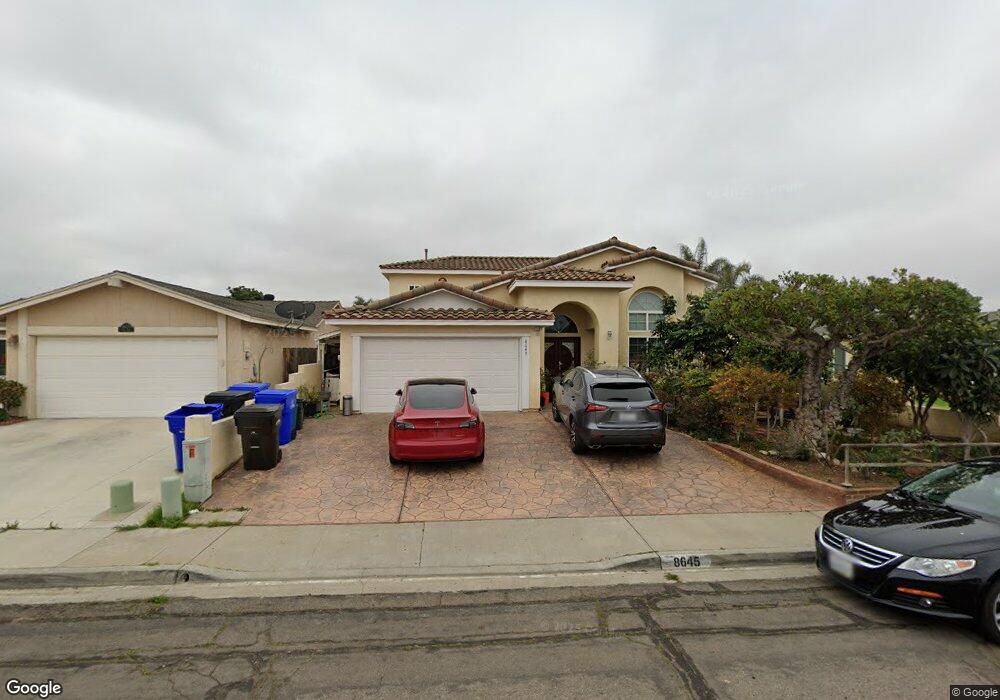
8645 Covina St San Diego, CA 92126
Mira Mesa NeighborhoodEstimated Value: $1,079,000 - $1,603,000
4
Beds
4
Baths
2,563
Sq Ft
$517/Sq Ft
Est. Value
About This Home
This home is located at 8645 Covina St, San Diego, CA 92126 and is currently estimated at $1,324,423, approximately $516 per square foot. 8645 Covina St is a home located in San Diego County with nearby schools including Mason Elementary School, Wangenheim Middle School, and Mira Mesa High School.
Ownership History
Date
Name
Owned For
Owner Type
Purchase Details
Closed on
Apr 28, 2017
Sold by
Tran Robert
Bought by
Tran John and Phan Tran Kimchi T
Current Estimated Value
Purchase Details
Closed on
Jul 9, 2015
Sold by
Tran John and Phan Tran Kimchi T
Bought by
Tran Robert
Purchase Details
Closed on
Jul 31, 2013
Sold by
Tran John and Phan Tran Kim Chi
Bought by
Tran John and Phan Tran Kim Chi
Purchase Details
Closed on
Jun 18, 2008
Sold by
Tran John
Bought by
Tran John and Phan Tran Kimchi T
Purchase Details
Closed on
Apr 25, 2006
Sold by
Tran Xuan My and Tran John
Bought by
Tran John
Home Financials for this Owner
Home Financials are based on the most recent Mortgage that was taken out on this home.
Original Mortgage
$250,000
Outstanding Balance
$147,856
Interest Rate
6.87%
Mortgage Type
Purchase Money Mortgage
Estimated Equity
$1,176,567
Purchase Details
Closed on
Sep 18, 1998
Sold by
Lam Thomas T and Lam Diana T
Bought by
Tran Xuan My and Tran John
Purchase Details
Closed on
Feb 17, 1989
Create a Home Valuation Report for This Property
The Home Valuation Report is an in-depth analysis detailing your home's value as well as a comparison with similar homes in the area
Home Values in the Area
Average Home Value in this Area
Purchase History
| Date | Buyer | Sale Price | Title Company |
|---|---|---|---|
| Tran John | -- | None Available | |
| Tran Robert | -- | None Available | |
| Tran John | -- | None Available | |
| Tran John | -- | Lenders Choice Title | |
| Tran John | -- | Alliance Title Company | |
| Tran Xuan My | -- | First American Title | |
| -- | $149,900 | -- |
Source: Public Records
Mortgage History
| Date | Status | Borrower | Loan Amount |
|---|---|---|---|
| Open | Tran John | $250,000 |
Source: Public Records
Tax History Compared to Growth
Tax History
| Year | Tax Paid | Tax Assessment Tax Assessment Total Assessment is a certain percentage of the fair market value that is determined by local assessors to be the total taxable value of land and additions on the property. | Land | Improvement |
|---|---|---|---|---|
| 2025 | $9,135 | $754,377 | $435,217 | $319,160 |
| 2024 | $9,135 | $739,586 | $426,684 | $312,902 |
| 2023 | $8,933 | $725,085 | $418,318 | $306,767 |
| 2022 | $8,695 | $710,868 | $410,116 | $300,752 |
| 2021 | $8,635 | $696,930 | $402,075 | $294,855 |
| 2020 | $8,531 | $689,785 | $397,953 | $291,832 |
| 2019 | $8,378 | $676,260 | $390,150 | $286,110 |
| 2018 | $7,834 | $663,000 | $382,500 | $280,500 |
| 2017 | $7,256 | $616,775 | $336,936 | $279,839 |
| 2016 | $7,140 | $604,682 | $330,330 | $274,352 |
| 2015 | $6,067 | $513,187 | $198,646 | $314,541 |
| 2014 | $5,890 | $503,135 | $194,755 | $308,380 |
Source: Public Records
Map
Nearby Homes
- 10265 Eagle Rock Ave
- 8516 Flanders Dr
- 10422 Londonderry Ave
- 10174 Camino Ruiz Unit 46
- 10166 Camino Ruiz Unit 32
- 10573 Caminito Flores
- 14331 Montano Way
- 14341 Montano Way
- 14659 Dunleer Way
- 14633 Dunleer Way
- 14665 Dunleer Way
- 14641 Dunleer Way
- 8670 New Salem St Unit 106
- 10582 Caminito Glenellen
- 8650 New Salem St Unit 27
- 8644 New Salem St Unit 6
- 8654 New Salem St Unit 44
- 10284 Black Mountain Rd Unit 198
- 10222 Black Mountain Rd Unit 69
- 10258 Black Mountain Rd Unit 145
- 8655 Covina St
- 8635 Covina St
- 8646 Longwood St
- 8665 Covina St
- 8625 Covina St
- 8636 Longwood St
- 8656 Longwood St
- 8626 Longwood St
- 8666 Longwood St
- 8640 Covina St
- 8652 Covina St
- 8675 Covina St
- 8615 Covina St
- 8664 Covina St
- 8676 Longwood St
- 8616 Longwood St
- 8676 Covina St
- 8685 Covina St
- 8605 Covina St
- 8686 Longwood St