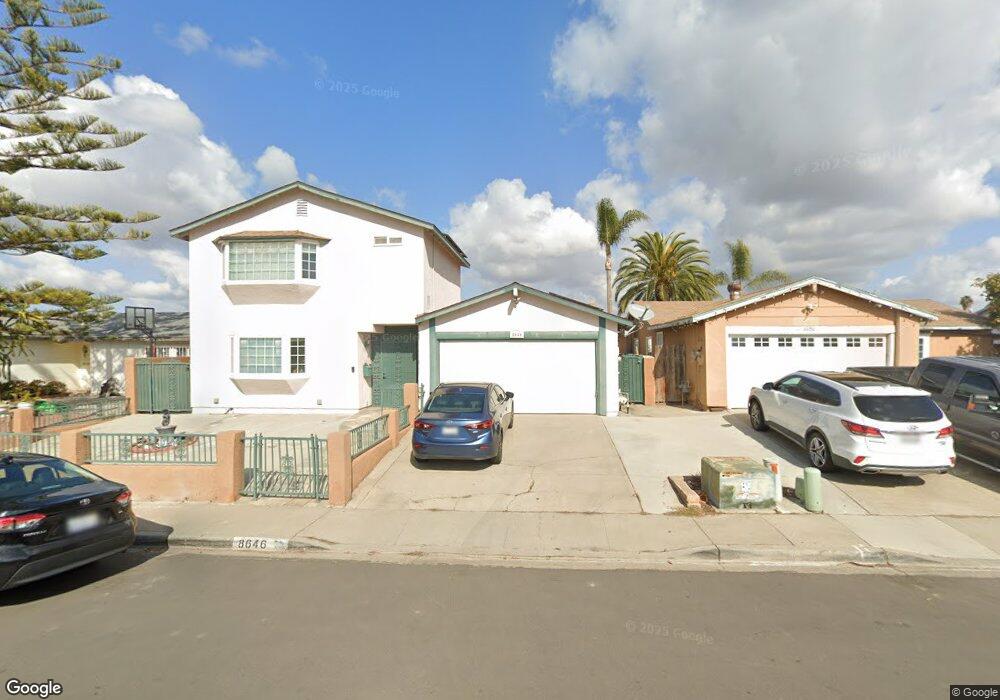
8646 Ferndale St San Diego, CA 92126
Mira Mesa NeighborhoodEstimated Value: $1,115,000 - $1,318,902
5
Beds
3
Baths
2,661
Sq Ft
$458/Sq Ft
Est. Value
About This Home
This home is located at 8646 Ferndale St, San Diego, CA 92126 and is currently estimated at $1,219,226, approximately $458 per square foot. 8646 Ferndale St is a home located in San Diego County with nearby schools including Mason Elementary School, Wangenheim Middle School, and Mira Mesa High School.
Ownership History
Date
Name
Owned For
Owner Type
Purchase Details
Closed on
Aug 9, 2017
Sold by
Kare Benito and Kare Dolores
Bought by
Vanvankeo Mony Van and Keo Alyssa
Current Estimated Value
Home Financials for this Owner
Home Financials are based on the most recent Mortgage that was taken out on this home.
Original Mortgage
$567,765
Outstanding Balance
$467,756
Interest Rate
3.5%
Mortgage Type
FHA
Estimated Equity
$751,470
Purchase Details
Closed on
Mar 22, 2013
Sold by
Mccarthy Joel D and Mccarthy Emerie D
Bought by
Kare Benito and Kare Dolores
Home Financials for this Owner
Home Financials are based on the most recent Mortgage that was taken out on this home.
Original Mortgage
$344,000
Interest Rate
3.47%
Mortgage Type
New Conventional
Purchase Details
Closed on
Mar 18, 2005
Sold by
Mccarthy Joel D
Bought by
Mccarthy Joel D and Mccarthy Emerie D
Purchase Details
Closed on
Oct 22, 2004
Sold by
Mccarthy Joel D and Mccarthy Emerie D
Bought by
Mccarthy Joel D
Home Financials for this Owner
Home Financials are based on the most recent Mortgage that was taken out on this home.
Original Mortgage
$446,250
Interest Rate
5.72%
Mortgage Type
New Conventional
Purchase Details
Closed on
Dec 11, 1989
Create a Home Valuation Report for This Property
The Home Valuation Report is an in-depth analysis detailing your home's value as well as a comparison with similar homes in the area
Home Values in the Area
Average Home Value in this Area
Purchase History
| Date | Buyer | Sale Price | Title Company |
|---|---|---|---|
| Vanvankeo Mony Van | $620,000 | First American Title Company | |
| Kare Benito | $430,000 | Ticor Title | |
| Mccarthy Joel D | -- | -- | |
| Mccarthy Joel D | -- | Alliance Title Company | |
| -- | $158,000 | -- |
Source: Public Records
Mortgage History
| Date | Status | Borrower | Loan Amount |
|---|---|---|---|
| Open | Vanvankeo Mony Van | $567,765 | |
| Previous Owner | Kare Benito | $344,000 | |
| Previous Owner | Mccarthy Joel D | $446,250 |
Source: Public Records
Tax History Compared to Growth
Tax History
| Year | Tax Paid | Tax Assessment Tax Assessment Total Assessment is a certain percentage of the fair market value that is determined by local assessors to be the total taxable value of land and additions on the property. | Land | Improvement |
|---|---|---|---|---|
| 2025 | $8,460 | $705,448 | $410,146 | $295,302 |
| 2024 | $8,460 | $691,616 | $402,104 | $289,512 |
| 2023 | $8,272 | $678,056 | $394,220 | $283,836 |
| 2022 | $8,049 | $664,762 | $386,491 | $278,271 |
| 2021 | $7,992 | $651,728 | $378,913 | $272,815 |
| 2020 | $7,894 | $645,046 | $375,028 | $270,018 |
| 2019 | $7,751 | $632,399 | $367,675 | $264,724 |
| 2018 | $7,329 | $620,000 | $360,466 | $259,534 |
| 2017 | $80 | $456,244 | $265,259 | $190,985 |
| 2016 | $5,292 | $447,299 | $260,058 | $187,241 |
| 2015 | $5,215 | $440,581 | $256,152 | $184,429 |
| 2014 | $5,133 | $431,952 | $251,135 | $180,817 |
Source: Public Records
Map
Nearby Homes
- 10265 Eagle Rock Ave
- 8516 Flanders Dr
- 10174 Camino Ruiz Unit 46
- 10166 Camino Ruiz Unit 32
- 10422 Londonderry Ave
- 10573 Caminito Flores
- 14331 Montano Way
- 14341 Montano Way
- 14659 Dunleer Way
- 14633 Dunleer Way
- 14641 Dunleer Way
- 8670 New Salem St Unit 106
- 10582 Caminito Glenellen
- 10284 Black Mountain Rd Unit 198
- 10222 Black Mountain Rd Unit 69
- 8650 New Salem St Unit 27
- 8644 New Salem St Unit 6
- 8654 New Salem St Unit 44
- 10226 Black Mountain Rd Unit 78
- 10296 Black Mountain Rd Unit 220
- 8656 Ferndale St
- 8636 Ferndale St
- 8645 Longwood St
- 8666 Ferndale St
- 8626 Ferndale St
- 8635 Longwood St
- 8655 Longwood St
- 8625 Longwood St
- 8665 Longwood St
- 8676 Ferndale St
- 8616 Ferndale St Unit 10
- 8655 Ferndale St
- 8635 Ferndale St
- 8665 Ferndale St
- 8615 Longwood St
- 8675 Longwood St
- 8625 Ferndale St
- 8686 Ferndale St
- 8606 Ferndale St
- 8675 Ferndale St