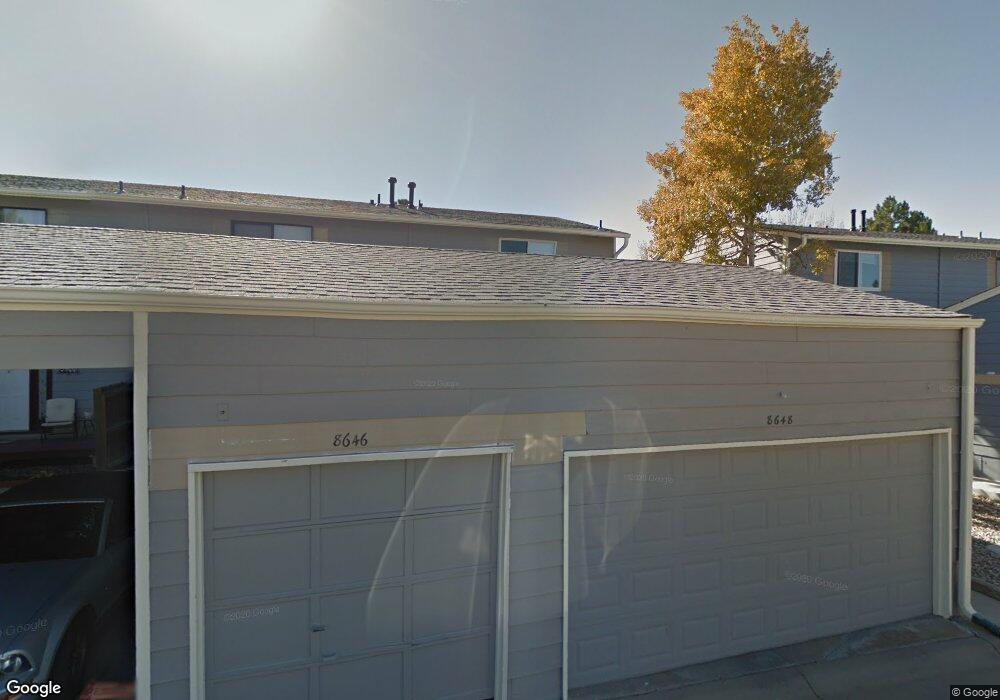
8648 Carr Loop Arvada, CO 80005
Trailside NeighborhoodEstimated Value: $361,000 - $386,000
2
Beds
2
Baths
1,100
Sq Ft
$341/Sq Ft
Est. Value
About This Home
This home is located at 8648 Carr Loop, Arvada, CO 80005 and is currently estimated at $375,637, approximately $341 per square foot. 8648 Carr Loop is a home located in Jefferson County with nearby schools including Weber Elementary School, Pomona High School, and Woodrow Wilson Academy.
Ownership History
Date
Name
Owned For
Owner Type
Purchase Details
Closed on
May 25, 2022
Sold by
Bcl Ventures Llc
Bought by
Stillman Laila
Current Estimated Value
Home Financials for this Owner
Home Financials are based on the most recent Mortgage that was taken out on this home.
Original Mortgage
$368,000
Outstanding Balance
$348,077
Interest Rate
5.25%
Mortgage Type
New Conventional
Estimated Equity
$27,560
Purchase Details
Closed on
Apr 13, 2022
Sold by
David Cain Eric
Bought by
Bcl Ventures Llc
Home Financials for this Owner
Home Financials are based on the most recent Mortgage that was taken out on this home.
Original Mortgage
$368,000
Outstanding Balance
$348,077
Interest Rate
5.25%
Mortgage Type
New Conventional
Estimated Equity
$27,560
Purchase Details
Closed on
Nov 27, 2015
Sold by
Burke Bruce P and Burke Lou A
Bought by
Cain Eric
Home Financials for this Owner
Home Financials are based on the most recent Mortgage that was taken out on this home.
Original Mortgage
$222,687
Interest Rate
3.85%
Mortgage Type
VA
Create a Home Valuation Report for This Property
The Home Valuation Report is an in-depth analysis detailing your home's value as well as a comparison with similar homes in the area
Home Values in the Area
Average Home Value in this Area
Purchase History
| Date | Buyer | Sale Price | Title Company |
|---|---|---|---|
| Stillman Laila | $460,000 | None Listed On Document | |
| Bcl Ventures Llc | $334,984 | None Listed On Document | |
| Cain Eric | $218,000 | Land Title Guarantee Company |
Source: Public Records
Mortgage History
| Date | Status | Borrower | Loan Amount |
|---|---|---|---|
| Open | Stillman Laila | $368,000 | |
| Closed | Bcl Ventures Llc | $310,500 | |
| Previous Owner | Cain Eric | $222,687 |
Source: Public Records
Tax History
| Year | Tax Paid | Tax Assessment Tax Assessment Total Assessment is a certain percentage of the fair market value that is determined by local assessors to be the total taxable value of land and additions on the property. | Land | Improvement |
|---|---|---|---|---|
| 2024 | $1,553 | $20,389 | $6,030 | $14,359 |
| 2023 | $1,553 | $20,389 | $6,030 | $14,359 |
| 2022 | $1,397 | $17,959 | $4,170 | $13,789 |
| 2021 | $1,417 | $18,476 | $4,290 | $14,186 |
| 2020 | $1,365 | $17,895 | $4,290 | $13,605 |
| 2019 | $1,343 | $17,895 | $4,290 | $13,605 |
| 2018 | $1,182 | $15,228 | $3,600 | $11,628 |
| 2017 | $1,058 | $15,228 | $3,600 | $11,628 |
| 2016 | $945 | $12,617 | $2,866 | $9,751 |
| 2015 | $843 | $12,617 | $2,866 | $9,751 |
| 2014 | $843 | $10,484 | $2,229 | $8,255 |
Source: Public Records
Map
Nearby Homes
- 8612 Carr Loop
- 8686 Carr Loop
- 8336 W 87th Dr Unit D
- 8651 W 88th Place
- 8787 Dover Cir
- 8352 W 90th Ave
- 8465 Dover Way
- 7940 W 90th Ave Unit 100
- 8362 W 90th Ave
- 7770 W 87th Dr Unit D
- 14551 W 91st Ln Unit A
- 8438 Everett Way Unit B
- 7730 W 87th Dr Unit I
- 8430 Everett Way Unit E
- 7780 W 87th Dr Unit E
- 7720 W 87th Dr Unit C
- 8442 Everett Way Unit D
- 8733 Yukon St
- 7870 W 87th Dr Unit J
- 9002 W 88th Cir
- 8646 Carr Loop
- 8652 Carr Loop
- 8644 Carr Loop
- 8654 Carr Loop
- 8642 Carr Loop
- 8642 Carr Loop Unit 8642
- 8656 Carr Loop
- 8658 Carr Loop
- 8636 Carr Loop
- 8660 Carr Loop
- 8643 Carr Loop
- 8634 Carr Loop
- 8647 Carr Loop
- 8649 Carr Loop
- 8662 Carr Loop
- 8632 Carr Loop
- 8621 Carr Loop
- 8619 Carr Loop
- 8664 Carr Loop
- 8617 Carr Loop
Your Personal Tour Guide
Ask me questions while you tour the home.