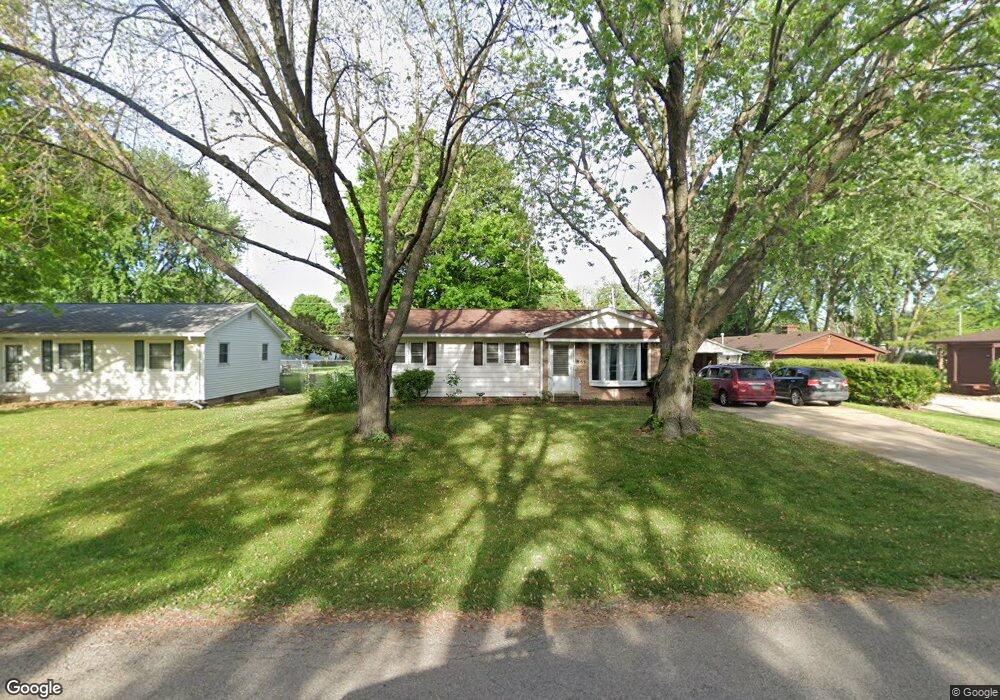
865 Belle St Waterloo, IA 50702
Estimated Value: $180,453 - $193,000
3
Beds
1
Bath
1,435
Sq Ft
$130/Sq Ft
Est. Value
About This Home
This home is located at 865 Belle St, Waterloo, IA 50702 and is currently estimated at $187,113, approximately $130 per square foot. 865 Belle St is a home located in Black Hawk County with nearby schools including Orange Elementary School, Hoover Middle School, and West High School.
Ownership History
Date
Name
Owned For
Owner Type
Purchase Details
Closed on
Mar 15, 2024
Sold by
Negus Ashley Ann
Bought by
Negus Wesley Word
Current Estimated Value
Purchase Details
Closed on
Aug 12, 2013
Sold by
Buck David M and Buck Kay E
Bought by
Negus Wesley W and Negus Ashley A
Home Financials for this Owner
Home Financials are based on the most recent Mortgage that was taken out on this home.
Original Mortgage
$135,000
Interest Rate
4.25%
Mortgage Type
VA
Purchase Details
Closed on
Jun 10, 2010
Sold by
Vanschoyck Milo J and Van Schoyack Jessie H
Bought by
Buck David M and Buck Kay E
Home Financials for this Owner
Home Financials are based on the most recent Mortgage that was taken out on this home.
Original Mortgage
$96,000
Interest Rate
5.13%
Mortgage Type
New Conventional
Create a Home Valuation Report for This Property
The Home Valuation Report is an in-depth analysis detailing your home's value as well as a comparison with similar homes in the area
Purchase History
| Date | Buyer | Sale Price | Title Company |
|---|---|---|---|
| Negus Wesley Word | -- | None Listed On Document | |
| Negus Wesley W | $135,000 | None Available | |
| Buck David M | $120,000 | None Available |
Source: Public Records
Mortgage History
| Date | Status | Borrower | Loan Amount |
|---|---|---|---|
| Previous Owner | Negus Wesley W | $135,000 | |
| Previous Owner | Buck David M | $96,000 |
Source: Public Records
Tax History
| Year | Tax Paid | Tax Assessment Tax Assessment Total Assessment is a certain percentage of the fair market value that is determined by local assessors to be the total taxable value of land and additions on the property. | Land | Improvement |
|---|---|---|---|---|
| 2025 | -- | $161,920 | $22,950 | $138,970 |
| 2024 | $2,524 | $159,790 | $22,950 | $136,840 |
| 2023 | $2,524 | $159,790 | $22,950 | $136,840 |
| 2022 | $2,456 | $127,210 | $22,950 | $104,260 |
| 2021 | $2,464 | $127,210 | $22,950 | $104,260 |
| 2020 | $2,418 | $120,670 | $18,360 | $102,310 |
| 2019 | $2,418 | $120,670 | $18,360 | $102,310 |
| 2018 | $2,422 | $120,670 | $18,360 | $102,310 |
| 2017 | $2,500 | $120,670 | $18,360 | $102,310 |
| 2016 | $2,464 | $120,670 | $18,360 | $102,310 |
| 2015 | $2,464 | $120,670 | $18,360 | $102,310 |
| 2014 | $2,400 | $115,800 | $18,360 | $97,440 |
Source: Public Records
Map
Nearby Homes
- 825 Belle St
- 860 Juniper Dr
- 836 Juniper Dr
- 420 Crestridge Dr
- 56 Acres Hwy 218
- 4157 Omaha Ave
- 11 Silver Lake Dr
- Lot 13 Fran
- Lot 29 Fran
- 5462 Tucson Dr
- 1203 Fran St
- Lot 9 Fran St
- 613 1st St
- 35 acres North Ave
- 710 2nd St
- 3905 Memory Ln
- 2225 E Shaulis Rd
- 5702 Aster Ln
- 5658 Summerland Dr
- +/- 3.88 Acres E Shaulis Rd
Your Personal Tour Guide
Ask me questions while you tour the home.