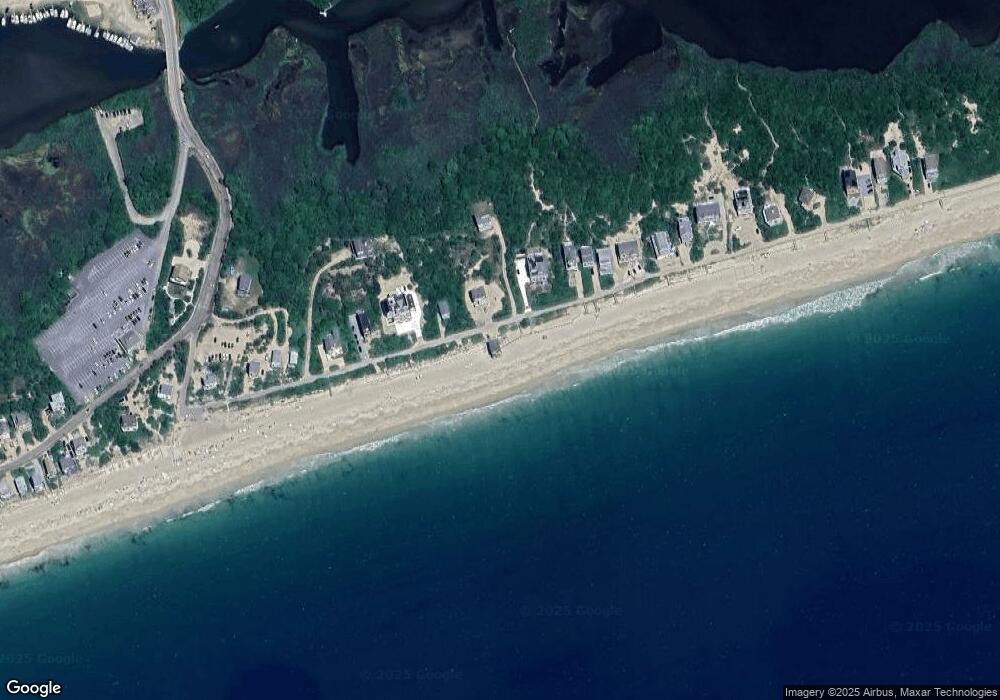
865 Charlestown Beach Rd Rhode Island, CT 02879
Estimated Value: $507,000 - $1,767,000
3
Beds
2
Baths
768
Sq Ft
$1,688/Sq Ft
Est. Value
About This Home
This home is located at 865 Charlestown Beach Rd, Rhode Island, CT 02879 and is currently estimated at $1,296,286, approximately $1,687 per square foot. 865 Charlestown Beach Rd is a home located in Washington County with nearby schools including Chariho Regional Middle School and Chariho High School.
Ownership History
Date
Name
Owned For
Owner Type
Purchase Details
Closed on
May 11, 2017
Sold by
Welch David
Bought by
Stilts Llc
Current Estimated Value
Purchase Details
Closed on
Mar 31, 1995
Sold by
Ekeblad Russell and Ekeblad Sheila
Bought by
Greene Joyce E
Create a Home Valuation Report for This Property
The Home Valuation Report is an in-depth analysis detailing your home's value as well as a comparison with similar homes in the area
Home Values in the Area
Average Home Value in this Area
Purchase History
| Date | Buyer | Sale Price | Title Company |
|---|---|---|---|
| Stilts Llc | -- | -- | |
| Welch David | $628,000 | -- | |
| Greene Joyce E | $295,000 | -- |
Source: Public Records
Mortgage History
| Date | Status | Borrower | Loan Amount |
|---|---|---|---|
| Previous Owner | Greene Joyce E | $1,120,000 | |
| Previous Owner | Greene Joyce E | $320,000 | |
| Previous Owner | Greene Joyce E | $320,000 |
Source: Public Records
Tax History Compared to Growth
Tax History
| Year | Tax Paid | Tax Assessment Tax Assessment Total Assessment is a certain percentage of the fair market value that is determined by local assessors to be the total taxable value of land and additions on the property. | Land | Improvement |
|---|---|---|---|---|
| 2025 | $11,626 | $1,300,400 | $1,159,000 | $141,400 |
| 2024 | $11,113 | $1,005,700 | $892,000 | $113,700 |
| 2023 | $11,113 | $1,005,700 | $892,000 | $113,700 |
| 2022 | $11,012 | $1,005,700 | $892,000 | $113,700 |
| 2021 | $9,374 | $648,700 | $549,700 | $99,000 |
| 2020 | $9,374 | $648,700 | $549,700 | $99,000 |
| 2019 | $9,374 | $648,700 | $549,700 | $99,000 |
| 2018 | $17,551 | $1,119,300 | $1,034,400 | $84,900 |
| 2017 | $17,136 | $1,119,300 | $1,034,400 | $84,900 |
| 2016 | $16,890 | $1,119,300 | $1,034,400 | $84,900 |
| 2015 | $15,897 | $1,024,300 | $940,100 | $84,200 |
| 2014 | $15,856 | $1,024,300 | $940,100 | $84,200 |
Source: Public Records
Map
Nearby Homes