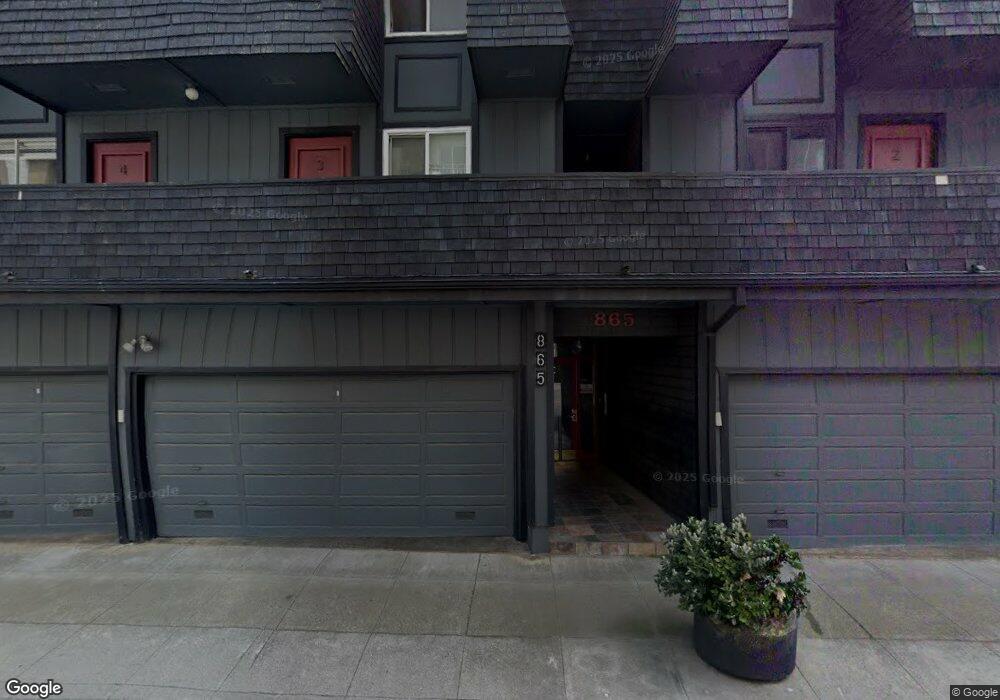
865 Corbett Ave Unit 5 San Francisco, CA 94131
Twin Peaks NeighborhoodEstimated Value: $674,000 - $919,000
2
Beds
1
Bath
857
Sq Ft
$939/Sq Ft
Est. Value
About This Home
This home is located at 865 Corbett Ave Unit 5, San Francisco, CA 94131 and is currently estimated at $804,929, approximately $939 per square foot. 865 Corbett Ave Unit 5 is a home located in San Francisco County with nearby schools including Clarendon Alternative Elementary School, Presidio Middle School, and St. Brendan Elementary School.
Ownership History
Date
Name
Owned For
Owner Type
Purchase Details
Closed on
Jun 14, 2011
Sold by
Beale David G
Bought by
Wilburn Pascal E
Current Estimated Value
Home Financials for this Owner
Home Financials are based on the most recent Mortgage that was taken out on this home.
Original Mortgage
$406,600
Outstanding Balance
$279,379
Interest Rate
4.56%
Mortgage Type
New Conventional
Estimated Equity
$525,550
Purchase Details
Closed on
Jun 5, 1996
Sold by
Federal Home Loan Mortgage Corporation
Bought by
Beale Barbara A
Home Financials for this Owner
Home Financials are based on the most recent Mortgage that was taken out on this home.
Original Mortgage
$161,400
Interest Rate
7.96%
Purchase Details
Closed on
Feb 26, 1996
Sold by
Ge Capital Mtg Services Inc
Bought by
Federal Home Loan Mortgage Corporation
Purchase Details
Closed on
Feb 19, 1996
Sold by
Brady Steven J
Bought by
G E Capital Mtg Services Inc
Create a Home Valuation Report for This Property
The Home Valuation Report is an in-depth analysis detailing your home's value as well as a comparison with similar homes in the area
Home Values in the Area
Average Home Value in this Area
Purchase History
| Date | Buyer | Sale Price | Title Company |
|---|---|---|---|
| Wilburn Pascal E | $428,000 | Fidelity National Title Co | |
| Beale Barbara A | $170,000 | Fidelity National Title Co | |
| Federal Home Loan Mortgage Corporation | -- | Fidelity National Title Co | |
| G E Capital Mtg Services Inc | $276,427 | Fidelity National Title |
Source: Public Records
Mortgage History
| Date | Status | Borrower | Loan Amount |
|---|---|---|---|
| Open | Wilburn Pascal E | $406,600 | |
| Previous Owner | Beale Barbara A | $161,400 |
Source: Public Records
Tax History Compared to Growth
Tax History
| Year | Tax Paid | Tax Assessment Tax Assessment Total Assessment is a certain percentage of the fair market value that is determined by local assessors to be the total taxable value of land and additions on the property. | Land | Improvement |
|---|---|---|---|---|
| 2025 | $7,160 | $548,332 | $383,834 | $164,498 |
| 2024 | $7,160 | $537,581 | $376,308 | $161,273 |
| 2023 | $7,026 | $527,041 | $368,930 | $158,111 |
| 2022 | $6,875 | $516,708 | $361,697 | $155,011 |
| 2021 | $6,750 | $506,577 | $354,605 | $151,972 |
| 2020 | $6,796 | $501,383 | $350,969 | $150,414 |
| 2019 | $6,568 | $491,553 | $344,088 | $147,465 |
| 2018 | $6,350 | $481,916 | $337,342 | $144,574 |
| 2017 | $5,977 | $472,468 | $330,728 | $141,740 |
| 2016 | $5,861 | $463,205 | $324,244 | $138,961 |
| 2015 | $5,787 | $456,248 | $319,374 | $136,874 |
| 2014 | $5,638 | $447,311 | $313,118 | $134,193 |
Source: Public Records
Map
Nearby Homes
- 833 Corbett Ave
- 3890 Market St Unit 1
- 945 Corbett Ave Unit 206
- 4454 23rd St Unit 2
- 160 Gardenside Dr Unit 101
- 767 Corbett Ave Unit 3
- 930 Elizabeth St Unit 1
- 755 Corbett Ave
- 3711 Market St Unit 2
- 1 Hoffman Ave Unit C
- 1 Hoffman Ave Unit A
- 20 Parkridge Dr Unit 12
- 8 Fountain St
- 672 Corbett Ave Unit C
- 892 Corbett Ave
- 464 Hoffman Ave
- 447 Hoffman Ave
- 1230 1240 Twin Peaks Blvd
- 729 Douglass St
- 729 Douglass St Unit A
- 865 Corbett Ave Unit 4
- 865 Corbett Ave Unit 3
- 865 Corbett Ave Unit 2
- 865 Corbett Ave Unit 1
- 865 Corbett Ave Unit 6
- 865 Corbett Ave Unit 7
- 853 Corbett Ave
- 851 Corbett Ave
- 849 Corbett Ave
- 845 Corbett Ave
- 875 Corbett Ave
- 3858 Market St
- 841 Corbett Ave
- 881 Corbett Ave Unit 3
- 881 Corbett Ave Unit 1
- 881 Corbett Ave Unit 2
- 3880 Market St
- 885 Corbett Ave Unit 887
- 3840 Market St Unit 3
- 3840 Market St Unit 1