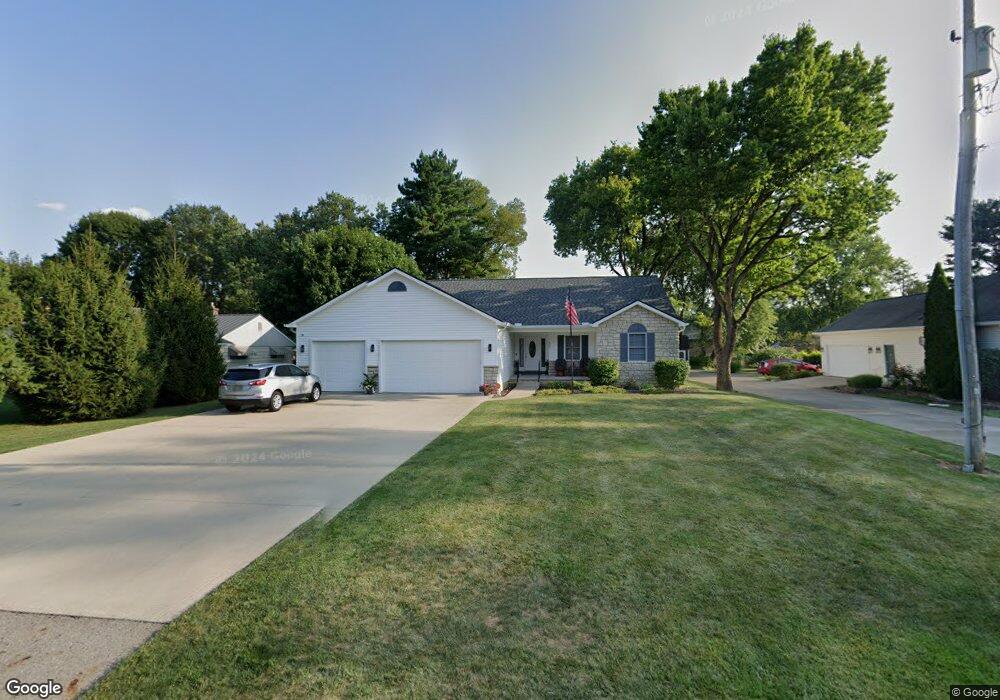
865 Elm St Groveport, OH 43125
Estimated Value: $371,000 - $416,000
3
Beds
3
Baths
1,782
Sq Ft
$222/Sq Ft
Est. Value
About This Home
This home is located at 865 Elm St, Groveport, OH 43125 and is currently estimated at $395,032, approximately $221 per square foot. 865 Elm St is a home located in Franklin County with nearby schools including Groveport Madison High School, Groveport Community School, and Madison Christian School.
Ownership History
Date
Name
Owned For
Owner Type
Purchase Details
Closed on
May 28, 2024
Sold by
Hougland John R
Bought by
Young John C and Young Diana G
Current Estimated Value
Home Financials for this Owner
Home Financials are based on the most recent Mortgage that was taken out on this home.
Original Mortgage
$160,000
Outstanding Balance
$158,035
Interest Rate
7.22%
Mortgage Type
New Conventional
Estimated Equity
$236,997
Purchase Details
Closed on
Mar 15, 2001
Sold by
Mcclish Paul S and Mcclish Margaret J
Bought by
Hougland John R and Hougland Charlene S
Purchase Details
Closed on
Nov 15, 1997
Sold by
Mcclish Paul S and Mcclish Margaret J
Bought by
Mcclish Paul Smith and Mcclish Margaret Jane
Purchase Details
Closed on
Jun 29, 1994
Sold by
Black Robert L
Bought by
David J Black
Create a Home Valuation Report for This Property
The Home Valuation Report is an in-depth analysis detailing your home's value as well as a comparison with similar homes in the area
Home Values in the Area
Average Home Value in this Area
Purchase History
| Date | Buyer | Sale Price | Title Company |
|---|---|---|---|
| Young John C | $410,000 | Landsel Title Agency | |
| Hougland John R | $22,000 | Title First Agency Inc | |
| Mcclish Paul Smith | -- | -- | |
| David J Black | $28,000 | -- |
Source: Public Records
Mortgage History
| Date | Status | Borrower | Loan Amount |
|---|---|---|---|
| Open | Young John C | $160,000 |
Source: Public Records
Tax History Compared to Growth
Tax History
| Year | Tax Paid | Tax Assessment Tax Assessment Total Assessment is a certain percentage of the fair market value that is determined by local assessors to be the total taxable value of land and additions on the property. | Land | Improvement |
|---|---|---|---|---|
| 2024 | $5,680 | $125,940 | $28,110 | $97,830 |
| 2023 | $5,660 | $125,940 | $28,110 | $97,830 |
| 2022 | $4,741 | $86,770 | $13,090 | $73,680 |
| 2021 | $4,758 | $86,770 | $13,090 | $73,680 |
| 2020 | $4,769 | $86,770 | $13,090 | $73,680 |
| 2019 | $4,403 | $72,240 | $10,920 | $61,320 |
| 2018 | $4,685 | $72,240 | $10,920 | $61,320 |
| 2017 | $4,437 | $72,240 | $10,920 | $61,320 |
| 2016 | $4,900 | $72,420 | $9,000 | $63,420 |
| 2015 | $4,943 | $72,420 | $9,000 | $63,420 |
| 2014 | $4,653 | $72,420 | $9,000 | $63,420 |
| 2013 | $2,103 | $76,230 | $9,485 | $66,745 |
Source: Public Records
Map
Nearby Homes
- 213 Front St
- 135 Front St
- 287 College St
- 7474 Groveport Rd
- 218-222 Center St
- 430 Maple St
- 199 Mohr Ave
- 5777 Ebright Rd
- 250 Green Ave
- 303 Madison St
- 4822 Elmont Place
- 5310 Sims Rd
- 5652 Red Alder St
- 5611 Shellbark St
- 5634 Shagbark Place
- 5156 Sand Ct
- 5151 Bixby Rd
- 5157 Bixford Ave
- 5424 Bixby Rd
- 4835 Grove Pointe Dr