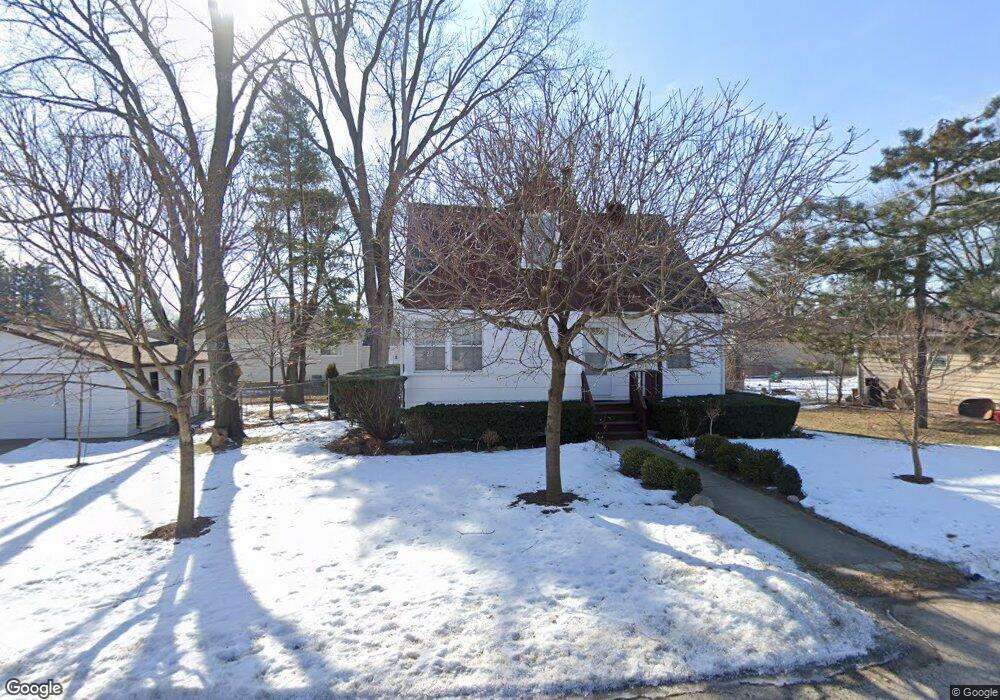
865 Kramer Ave Elgin, IL 60120
Southeast Elgin NeighborhoodEstimated Value: $266,008 - $276,000
3
Beds
2
Baths
1,166
Sq Ft
$233/Sq Ft
Est. Value
About This Home
This home is located at 865 Kramer Ave, Elgin, IL 60120 and is currently estimated at $272,002, approximately $233 per square foot. 865 Kramer Ave is a home located in Cook County with nearby schools including Huff Elementary School, Ellis Middle School, and Elgin High School.
Ownership History
Date
Name
Owned For
Owner Type
Purchase Details
Closed on
Oct 22, 2002
Sold by
Recklaus Tracy
Bought by
Andrade Jesus and Torres Rosa
Current Estimated Value
Home Financials for this Owner
Home Financials are based on the most recent Mortgage that was taken out on this home.
Original Mortgage
$140,553
Outstanding Balance
$57,338
Interest Rate
6.18%
Estimated Equity
$214,664
Purchase Details
Closed on
May 21, 2002
Sold by
Bank One
Bought by
Recklaus Tracy
Purchase Details
Closed on
Apr 8, 2002
Sold by
Valdez Roberto
Bought by
Bank One
Purchase Details
Closed on
Aug 14, 1998
Sold by
Gutierrez Arnulfo and Gutierrez Faye J
Bought by
Berlanga Jose D and Valdez Roberto
Home Financials for this Owner
Home Financials are based on the most recent Mortgage that was taken out on this home.
Original Mortgage
$95,920
Interest Rate
7.04%
Create a Home Valuation Report for This Property
The Home Valuation Report is an in-depth analysis detailing your home's value as well as a comparison with similar homes in the area
Home Values in the Area
Average Home Value in this Area
Purchase History
| Date | Buyer | Sale Price | Title Company |
|---|---|---|---|
| Andrade Jesus | $146,000 | -- | |
| Recklaus Tracy | $82,000 | First American Title | |
| Bank One | -- | -- | |
| Berlanga Jose D | $120,000 | -- |
Source: Public Records
Mortgage History
| Date | Status | Borrower | Loan Amount |
|---|---|---|---|
| Open | Andrade Jesus | $140,553 | |
| Previous Owner | Berlanga Jose D | $95,920 | |
| Closed | Berlanga Jose D | $17,985 |
Source: Public Records
Tax History
| Year | Tax Paid | Tax Assessment Tax Assessment Total Assessment is a certain percentage of the fair market value that is determined by local assessors to be the total taxable value of land and additions on the property. | Land | Improvement |
|---|---|---|---|---|
| 2025 | $4,515 | $25,000 | $2,695 | $22,305 |
| 2024 | $4,515 | $19,000 | $1,540 | $17,460 |
| 2023 | $4,358 | $19,000 | $1,540 | $17,460 |
| 2022 | $4,358 | $19,000 | $1,540 | $17,460 |
| 2021 | $3,550 | $13,633 | $1,058 | $12,575 |
| 2020 | $3,606 | $13,633 | $1,058 | $12,575 |
| 2019 | $3,644 | $15,319 | $1,058 | $14,261 |
| 2018 | $3,362 | $13,330 | $962 | $12,368 |
| 2017 | $3,820 | $14,654 | $962 | $13,692 |
| 2016 | $3,874 | $14,654 | $962 | $13,692 |
| 2015 | $3,806 | $13,455 | $866 | $12,589 |
| 2014 | $3,704 | $13,455 | $866 | $12,589 |
| 2013 | $3,563 | $13,455 | $866 | $12,589 |
Source: Public Records
Map
Nearby Homes
- 711 Bluff City Blvd
- 1061 Houston Ave
- 383 Woodview Cir Unit C
- 408 Bowen Ct
- 518 Raymond St
- 1020 Wynnfield Ct Unit D
- 356 Woodview Cir Unit A
- 1182 Concord Dr
- 483 Barrett St
- 286 Villa St
- 75 Willard Ave Unit 4
- 277 Gifford Place
- 832 Bode Rd
- 462 Ashland Ave
- 386 Campus Dr
- 133 Oak St
- 149 Highbury Dr
- 1701 Deer Pointe Dr
- 489 Division St
- 7 National St Unit 7
Your Personal Tour Guide
Ask me questions while you tour the home.