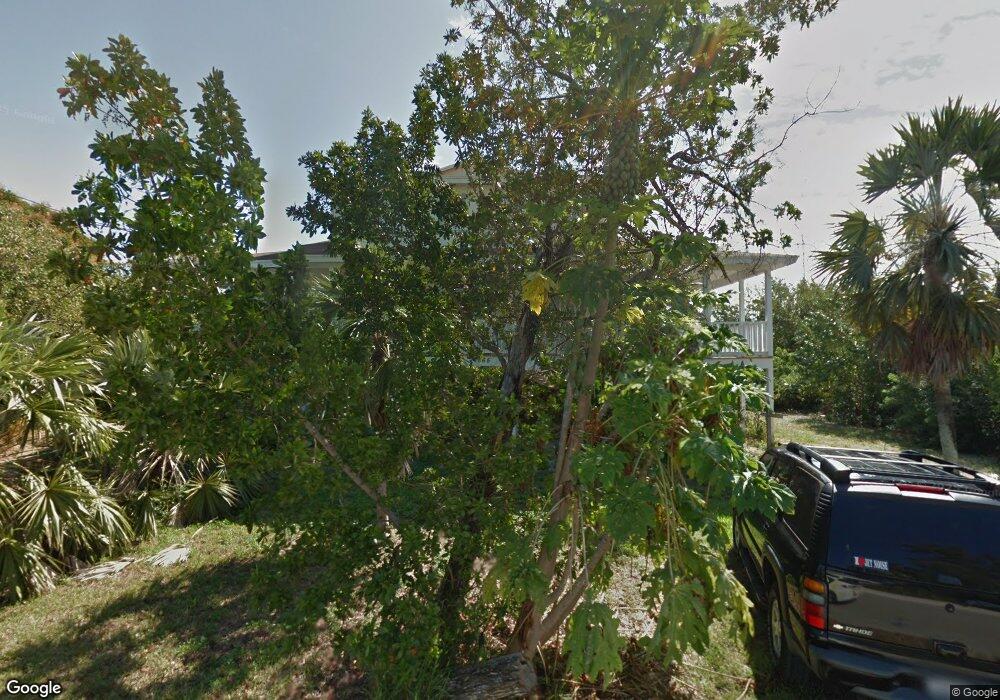
865 Loggerhead Ln Summerland Key, FL 33042
Estimated Value: $1,371,000 - $2,029,000
3
Beds
3
Baths
3,120
Sq Ft
$536/Sq Ft
Est. Value
About This Home
This home is located at 865 Loggerhead Ln, Summerland Key, FL 33042 and is currently estimated at $1,671,361, approximately $535 per square foot. 865 Loggerhead Ln is a home located in Monroe County with nearby schools including Sugarloaf School and Key West High School.
Ownership History
Date
Name
Owned For
Owner Type
Purchase Details
Closed on
Oct 18, 2011
Sold by
Federal Deposit Insurance Corporation
Bought by
Centennial Bank
Current Estimated Value
Purchase Details
Closed on
Jul 12, 2010
Sold by
Richardson John C
Bought by
Centennial Bank and Key West Bank Fsb
Purchase Details
Closed on
Dec 15, 2006
Sold by
Fithian Donald D and Fithian Pamela D
Bought by
Richardson John C and Richardson Bonnie B
Home Financials for this Owner
Home Financials are based on the most recent Mortgage that was taken out on this home.
Original Mortgage
$560,000
Interest Rate
5.87%
Mortgage Type
Purchase Money Mortgage
Purchase Details
Closed on
Aug 1, 1994
Bought by
Ackert Richard A and Ackert Diane F
Purchase Details
Closed on
May 1, 1989
Bought by
Ackert Richard A and Ackert Diane F
Purchase Details
Closed on
Sep 1, 1986
Bought by
Ackert Richard A and Ackert Diane F
Create a Home Valuation Report for This Property
The Home Valuation Report is an in-depth analysis detailing your home's value as well as a comparison with similar homes in the area
Purchase History
We collect this data history from publicly available records. To have your information removed, we recommend requesting removal directly through your county’s website.
| Date | Buyer | Sale Price | Title Company |
|---|---|---|---|
| Centennial Bank | $275,000 | None Available | |
| Ackert Richard A | $275,000 | Attorney | |
| Centennial Bank | -- | Attorney | |
| Richardson John C | -- | Chicago Title Of The Fl Keys | |
| Ackert Richard A | $230,000 | -- | |
| Ackert Richard A | $24,000 | -- | |
| Ackert Richard A | $22,000 | -- |
Source: Public Records
Mortgage History
We collect this data history from publicly available records. To have your information removed, we recommend requesting removal directly through your county’s website.
| Date | Status | Borrower | Loan Amount |
|---|---|---|---|
| Previous Owner | Richardson John C | $560,000 |
Source: Public Records
Tax History
| Year | Tax Paid | Tax Assessment Tax Assessment Total Assessment is a certain percentage of the fair market value that is determined by local assessors to be the total taxable value of land and additions on the property. | Land | Improvement |
|---|---|---|---|---|
| 2025 | $9,857 | $1,237,763 | $568,306 | $669,457 |
| 2024 | $9,226 | $1,242,445 | $568,306 | $674,139 |
| 2023 | $9,226 | $1,212,863 | $568,306 | $644,557 |
| 2022 | $8,506 | $1,109,789 | $458,425 | $651,364 |
| 2021 | $7,426 | $735,712 | $374,075 | $361,637 |
| 2020 | $7,492 | $735,803 | $374,075 | $361,728 |
| 2019 | $7,516 | $735,418 | $363,844 | $371,574 |
| 2018 | $7,157 | $677,244 | $300,701 | $376,543 |
| 2017 | $6,617 | $629,806 | $0 | $0 |
| 2016 | $6,227 | $567,845 | $0 | $0 |
| 2015 | $6,049 | $539,539 | $0 | $0 |
| 2014 | $5,728 | $475,211 | $0 | $0 |
Source: Public Records
Map
Nearby Homes
- 885 Hawksbill Ln
- 937 Loggerhead Ln
- 813 Hawksbill Ln
- Lot 15 bk2 Bad George Rd
- 0 Mira Rd
- Lot 32 Caloosa St
- 0 Acosta Trail Unit MFRS5141973
- 19464 Seminole St
- 0 Acosta Rd
- 19264 Acosta Trail
- 19657 Seminole St
- 19267 Hansen Trail
- 19611 Tequesta St
- Lot 6 Date Palm Dr
- 19525 Date Palm Dr
- 0 Rocky Rd
- LOT 57 Rocky Rd
- Lot 16 Date Palm Dr
- 19617 Date Palm Dr
- 19881 Date Palm Dr
- 874 Loggerhead Ln
- 886 Loggerhead Ln Unit SI ID1297829P
- 886 Loggerhead Ln Unit ID1297829P
- 886 Loggerhead Ln
- 862 Loggerhead Ln
- 908 Loggerhead Ln
- 943 Loggerhead Ln
- 940 Loggerhead Ln
- 959 Loggerhead Ln
- 873 Hawksbill Ln
- 00 Hawksbill Ln
- 30 Loggerhead Ln
- 861 Hawksbill Ln
- 952 Loggerhead Ln
- 907 Hawksbill Ln
- 921 Loggerhead Ln
- 849 Hawksbill Ln
- LOT 29 Loggerhead Ln
- 838 Loggerhead Ln
- 29 Loggerhead Ln
Your Personal Tour Guide
Ask me questions while you tour the home.