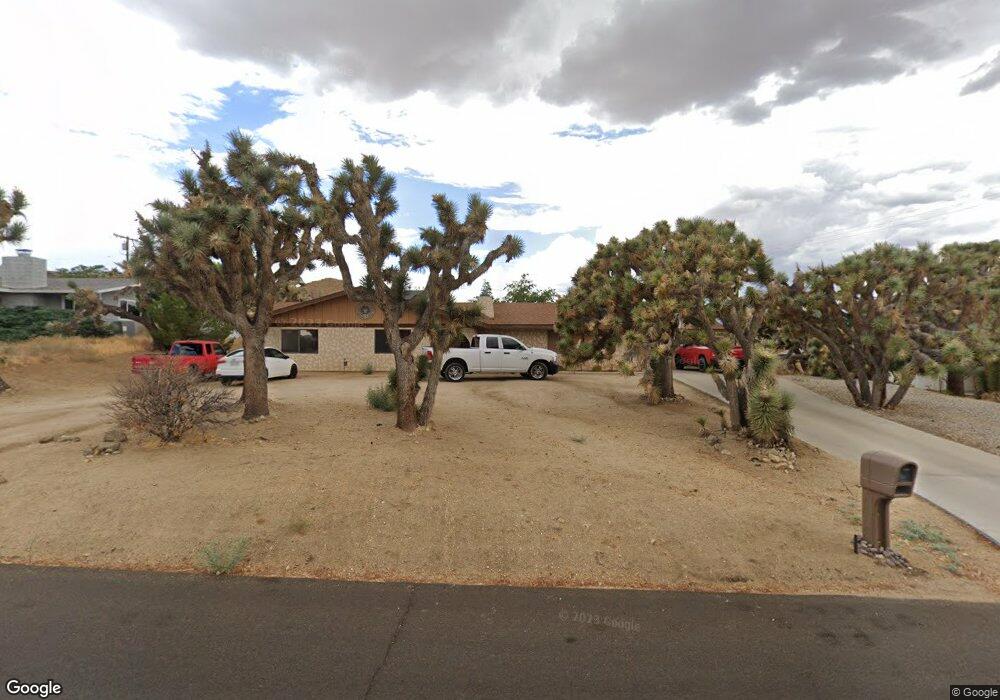
8650 Grand Ave Yucca Valley, CA 92284
Estimated Value: $303,000 - $388,000
3
Beds
2
Baths
1,684
Sq Ft
$210/Sq Ft
Est. Value
About This Home
This home is located at 8650 Grand Ave, Yucca Valley, CA 92284 and is currently estimated at $352,985, approximately $209 per square foot. 8650 Grand Ave is a home located in San Bernardino County with nearby schools including Onaga Elementary School, La Contenta Middle School, and Yucca Valley High School.
Ownership History
Date
Name
Owned For
Owner Type
Purchase Details
Closed on
Sep 27, 2025
Sold by
Pinder Roderick W
Bought by
Roderick Wayne Pinder Living Trust and Pinder
Current Estimated Value
Purchase Details
Closed on
Oct 21, 2010
Sold by
Federal Home Loan Mortgage Corporation
Bought by
Pinder Roderick W
Home Financials for this Owner
Home Financials are based on the most recent Mortgage that was taken out on this home.
Original Mortgage
$109,350
Interest Rate
4.33%
Mortgage Type
New Conventional
Purchase Details
Closed on
May 10, 2010
Sold by
Francois Marcia A
Bought by
Federal Home Loan Mortgage Corporation
Purchase Details
Closed on
Jan 8, 2007
Sold by
Valles Carmelita G
Bought by
Francois Marcia A
Home Financials for this Owner
Home Financials are based on the most recent Mortgage that was taken out on this home.
Original Mortgage
$155,200
Interest Rate
6.09%
Mortgage Type
Credit Line Revolving
Create a Home Valuation Report for This Property
The Home Valuation Report is an in-depth analysis detailing your home's value as well as a comparison with similar homes in the area
Home Values in the Area
Average Home Value in this Area
Purchase History
| Date | Buyer | Sale Price | Title Company |
|---|---|---|---|
| Pinder Roderick W | $121,500 | Lsi Title Company | |
| Federal Home Loan Mortgage Corporation | $104,701 | Fidelity Natl Title Ins Co | |
| Francois Marcia A | -- | Commonwealth Land Title |
Source: Public Records
Mortgage History
| Date | Status | Borrower | Loan Amount |
|---|---|---|---|
| Open | Pinder Roderick W | $109,350 | |
| Previous Owner | Francois Marcia A | $155,200 |
Source: Public Records
Tax History Compared to Growth
Tax History
| Year | Tax Paid | Tax Assessment Tax Assessment Total Assessment is a certain percentage of the fair market value that is determined by local assessors to be the total taxable value of land and additions on the property. | Land | Improvement |
|---|---|---|---|---|
| 2025 | $2,306 | $155,663 | $25,623 | $130,040 |
| 2024 | $2,306 | $152,611 | $25,121 | $127,490 |
| 2023 | $2,194 | $149,618 | $24,628 | $124,990 |
| 2022 | $2,083 | $146,684 | $24,145 | $122,539 |
| 2021 | $2,096 | $143,808 | $23,672 | $120,136 |
| 2020 | $2,080 | $142,333 | $23,429 | $118,904 |
| 2019 | $1,934 | $139,543 | $22,970 | $116,573 |
| 2018 | $1,719 | $136,807 | $22,520 | $114,287 |
| 2017 | $1,605 | $134,124 | $22,078 | $112,046 |
| 2016 | $1,574 | $131,494 | $21,645 | $109,849 |
| 2015 | $1,538 | $129,519 | $21,320 | $108,199 |
| 2014 | $1,523 | $126,982 | $20,902 | $106,080 |
Source: Public Records
Map
Nearby Homes
- 8687 Grand Ave
- 56620 Hidden Gold Dr
- 0 Hidden Gold Dr
- 56925 Hidden Gold Ct
- 56740 Free Gold Dr
- 8680 Monument View Dr
- 56662 El Dorado Dr
- 56661 Desert Gold Dr
- 56643 Desert Gold Dr
- 56811 Desert Gold Dr
- 56595 Desert Gold Dr
- 58075 El Dorado Dr
- 8305 Amador Ave
- 56488 El Dorado Dr
- 57088 Millstone Dr
- 57103 Juarez Dr
- 56363 Eagles Nest
- 56434 Desert Gold Dr
- 56455 Carlyle Dr
- 56975 San Andreas Rd
- 8612 Grand Ave
- 8668 Grand Ave
- 8630 Grand Ave
- 56744 Java Dr
- 8621 Amador Ave
- 56747 Ivanhoe Dr
- 8619 Amador Ave
- 8688 Grand Ave
- 8681 Gold Ave
- 8643 Amador Ave
- 8609 Amador Ave
- 56764 Java Dr
- 56759 Ivanhoe Dr
- 8706 Grand Ave
- 8594 Grand Ave
- 56763 Java Dr
- 56750 Ivanhoe Dr
- 8682 Gold Ave
- 8595 Amador Ave
- 8707 Grand Ave