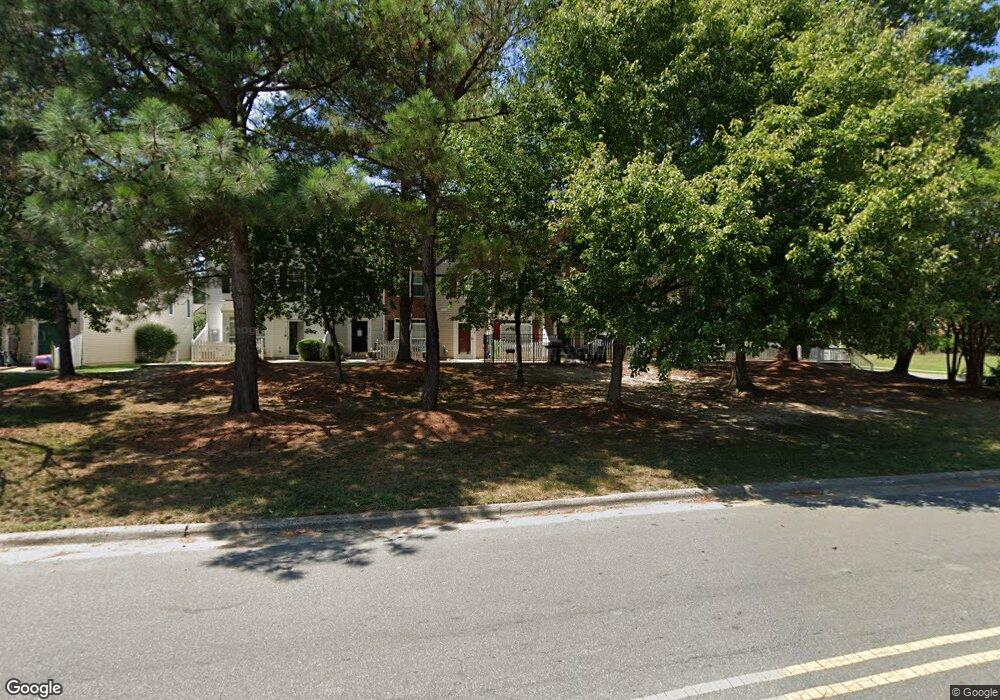
8650 Neuse Landing Ln Unit 103 Raleigh, NC 27616
Forestville NeighborhoodEstimated Value: $227,000 - $247,000
3
Beds
3
Baths
1,561
Sq Ft
$153/Sq Ft
Est. Value
About This Home
This home is located at 8650 Neuse Landing Ln Unit 103, Raleigh, NC 27616 and is currently estimated at $238,428, approximately $152 per square foot. 8650 Neuse Landing Ln Unit 103 is a home located in Wake County with nearby schools including Wildwood Forest Elementary, East Millbrook Middle, and Wakefield High School.
Ownership History
Date
Name
Owned For
Owner Type
Purchase Details
Closed on
Jun 24, 2019
Sold by
Hughes Jacgueline
Bought by
Hunter Harry Xavier
Current Estimated Value
Home Financials for this Owner
Home Financials are based on the most recent Mortgage that was taken out on this home.
Original Mortgage
$152,500
Outstanding Balance
$136,085
Interest Rate
4.87%
Mortgage Type
Adjustable Rate Mortgage/ARM
Estimated Equity
$102,343
Purchase Details
Closed on
Feb 1, 2002
Sold by
Perry Creek Townhomes Llc
Bought by
Hughes Jacqueline
Home Financials for this Owner
Home Financials are based on the most recent Mortgage that was taken out on this home.
Original Mortgage
$115,200
Interest Rate
7.16%
Mortgage Type
FHA
Create a Home Valuation Report for This Property
The Home Valuation Report is an in-depth analysis detailing your home's value as well as a comparison with similar homes in the area
Home Values in the Area
Average Home Value in this Area
Purchase History
| Date | Buyer | Sale Price | Title Company |
|---|---|---|---|
| Hunter Harry Xavier | $150,500 | None Available | |
| Hunter Harry Xavier | $150,500 | None Listed On Document | |
| Hughes Jacqueline | $118,000 | -- |
Source: Public Records
Mortgage History
| Date | Status | Borrower | Loan Amount |
|---|---|---|---|
| Open | Hunter Harry Xavier | $152,500 | |
| Closed | Hunter Harry Xavier | $152,500 | |
| Previous Owner | Hughes Jacqueline | $115,200 |
Source: Public Records
Tax History Compared to Growth
Tax History
| Year | Tax Paid | Tax Assessment Tax Assessment Total Assessment is a certain percentage of the fair market value that is determined by local assessors to be the total taxable value of land and additions on the property. | Land | Improvement |
|---|---|---|---|---|
| 2025 | $2,275 | $258,547 | -- | $258,547 |
| 2024 | $2,265 | $258,547 | $0 | $258,547 |
| 2023 | $1,658 | $150,237 | $0 | $150,237 |
| 2022 | $1,519 | $150,237 | $0 | $150,237 |
| 2021 | $1,482 | $150,237 | $0 | $150,237 |
| 2020 | $1,441 | $150,237 | $0 | $150,237 |
| 2019 | $1,244 | $106,793 | $0 | $106,793 |
| 2018 | $1,174 | $106,793 | $0 | $106,793 |
| 2017 | $1,119 | $106,793 | $0 | $106,793 |
| 2016 | $1,108 | $106,793 | $0 | $106,793 |
| 2015 | $1,299 | $123,528 | $0 | $123,528 |
| 2014 | $1,233 | $123,528 | $0 | $123,528 |
Source: Public Records
Map
Nearby Homes
- 8610 Neuse Landing Ln Unit 103
- 5121 Neuse Commons Ln
- 8620 Neuse Club Ln Unit 107
- 8640 Neuse Landing Ln Unit 110
- 8707 River Keeper Way
- 5107 Sandy Banks Rd
- 5163 Sandy Banks Rd
- 8857 Thornton Town Place
- 5126 Thornton Knoll Way
- 5309 Neuse Wood Dr
- 8885 Commons Townes Dr
- 4821 Gossamer Ln Unit 103
- 4821 Gossamer Ln Unit 102
- 8611 Brushfoot Way Unit 107
- 4820 Gossamer Ln Unit 101 & 102
- 8957 Commons Townes Dr
- 8947 Commons Townes Dr
- 4810 Gossamer Ln Unit 105
- 4801 Gossamer Ln Unit 106
- 8911 Elizabeth Benneth Place
- 8650 Neuse Landing Ln Unit 109
- 8650 Neuse Landing Ln Unit 112
- 8650 Neuse Landing Ln Unit 111
- 8650 Neuse Landing Ln Unit 110
- 8650 Neuse Landing Ln Unit 108
- 8650 Neuse Landing Ln Unit 107
- 8650 Neuse Landing Ln Unit 106
- 8650 Neuse Landing Ln Unit 105
- 8650 Neuse Landing Ln Unit 104
- 8650 Neuse Landing Ln Unit 102
- 8650 Neuse Landing Ln Unit 101
- 8650 Neuse Landing Ln
- 8650 Neuse Landing Ln
- 8650 Neuse Landing Ln Unit 111
- 13 Neuse Landing Ln
- 8700 Winding River Way
- 8640 Neuse Landing Ln Unit 112
- 8640 Neuse Landing Ln Unit 111
- 8640 Neuse Landing Ln Unit 109
- 8640 Neuse Landing Ln Unit 108