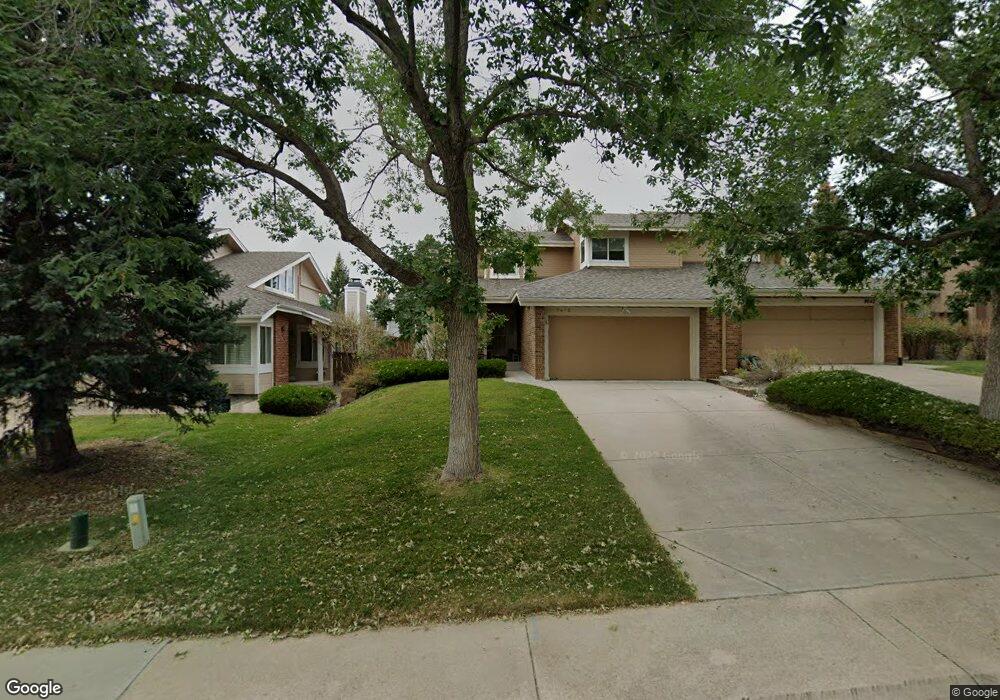
8653 Redstone St Highlands Ranch, CO 80126
Northridge NeighborhoodEstimated Value: $551,660 - $560,000
2
Beds
3
Baths
2,829
Sq Ft
$197/Sq Ft
Est. Value
About This Home
This home is located at 8653 Redstone St, Highlands Ranch, CO 80126 and is currently estimated at $556,665, approximately $196 per square foot. 8653 Redstone St is a home located in Douglas County with nearby schools including Sand Creek Elementary School, Mountain Ridge Middle School, and Mountain Vista High School.
Ownership History
Date
Name
Owned For
Owner Type
Purchase Details
Closed on
Aug 9, 2016
Sold by
Teresa M Carroll Trust
Bought by
Carroll Steven and Yi Inyeong
Current Estimated Value
Purchase Details
Closed on
Jul 31, 2013
Sold by
Klatt Leo E
Bought by
Teresa M Carroll Trust
Purchase Details
Closed on
Jul 26, 2006
Sold by
Thorpe John F
Bought by
Klatt Leo E and Klatt Jeannette C
Purchase Details
Closed on
Mar 22, 2002
Sold by
Norman Paul T
Bought by
Thorpe John F
Home Financials for this Owner
Home Financials are based on the most recent Mortgage that was taken out on this home.
Original Mortgage
$229,625
Interest Rate
6.78%
Purchase Details
Closed on
Feb 9, 2002
Sold by
Norman Lula C
Bought by
Norman Paul T
Home Financials for this Owner
Home Financials are based on the most recent Mortgage that was taken out on this home.
Original Mortgage
$229,625
Interest Rate
6.78%
Purchase Details
Closed on
Sep 26, 1989
Sold by
Mission Viejo Co
Bought by
Norman Paul T and Norman Lula C
Create a Home Valuation Report for This Property
The Home Valuation Report is an in-depth analysis detailing your home's value as well as a comparison with similar homes in the area
Home Values in the Area
Average Home Value in this Area
Purchase History
| Date | Buyer | Sale Price | Title Company |
|---|---|---|---|
| Carroll Steven | $376,000 | Stewart Title | |
| Teresa M Carroll Trust | $293,500 | Fidelity National Title Insu | |
| Klatt Leo E | -- | None Available | |
| Klatt Leo E | $248,000 | Title America | |
| Thorpe John F | $224,950 | -- | |
| Norman Paul T | -- | -- | |
| Norman Paul T | $110,500 | -- |
Source: Public Records
Mortgage History
| Date | Status | Borrower | Loan Amount |
|---|---|---|---|
| Previous Owner | Thorpe John F | $229,625 |
Source: Public Records
Tax History Compared to Growth
Tax History
| Year | Tax Paid | Tax Assessment Tax Assessment Total Assessment is a certain percentage of the fair market value that is determined by local assessors to be the total taxable value of land and additions on the property. | Land | Improvement |
|---|---|---|---|---|
| 2024 | $3,286 | $38,550 | $5,700 | $32,850 |
| 2023 | $3,280 | $38,550 | $5,700 | $32,850 |
| 2022 | $2,501 | $27,380 | $1,740 | $25,640 |
| 2021 | $2,602 | $27,380 | $1,740 | $25,640 |
| 2020 | $2,531 | $27,290 | $1,790 | $25,500 |
| 2019 | $2,540 | $27,290 | $1,790 | $25,500 |
| 2018 | $2,300 | $24,340 | $1,800 | $22,540 |
| 2017 | $2,095 | $24,340 | $1,800 | $22,540 |
| 2016 | $1,958 | $22,330 | $1,990 | $20,340 |
| 2015 | $2,000 | $22,330 | $1,990 | $20,340 |
| 2014 | $1,873 | $19,310 | $1,990 | $17,320 |
Source: Public Records
Map
Nearby Homes
- 1241 Northcrest Dr
- 1384 Briar Cir
- 1186 Cobblestone Dr
- 8397 Cobblestone Ct
- 1431 Northcrest Dr
- 8376 Cobblestone St
- 904 Fieldstone Place
- 8725 Meadowlark Cir
- 8745 Meadowlark Cir
- 1551 Northridge Dr
- 843 Homestead Dr
- 804 Homestead Dr
- 8606 Meadowlark Cir
- 8822 Eagles Nest Ln
- 8473 Tanglewood St
- 714 Old Stone Dr
- 8823 Maplewood Dr
- 8259 S Franklin Ct
- 507 Fox Hunt Cir
- 8441 Timberwood St
- 8663 Redstone St
- 8643 Redstone St
- 8673 Redstone St
- 8653 S Woody Way
- 8643 S Woody Way
- 8643 S Woody Way Unit 31
- 8683 Redstone St
- 8623 Redstone St
- 8663 S Woody Way
- 8654 Redstone St
- 8644 Redstone St
- 8664 Redstone St
- 8693 Redstone St
- 8633 S Woody Way
- 8603 Redstone St
- 8634 Redstone St
- 8684 Redstone St
- 8624 Redstone St
- 8673 S Woody Way
- 8593 Redstone St