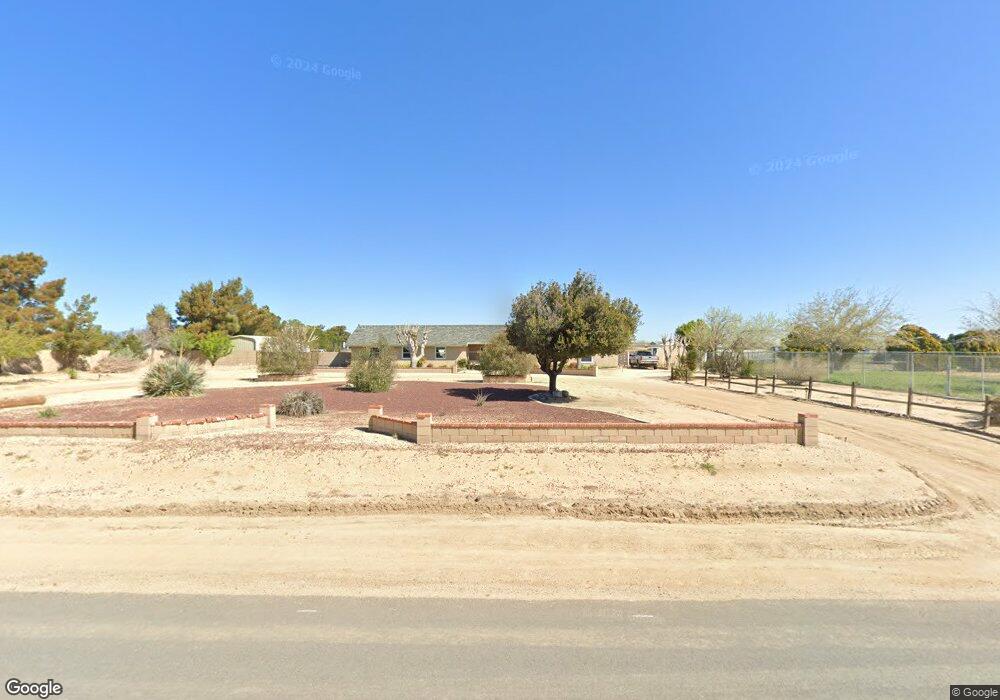
8653 West Ave E Lancaster, CA 93536
Northwest Antelope Valley NeighborhoodEstimated Value: $579,581 - $652,000
4
Beds
3
Baths
2,588
Sq Ft
$242/Sq Ft
Est. Value
About This Home
This home is located at 8653 West Ave E, Lancaster, CA 93536 and is currently estimated at $626,145, approximately $241 per square foot. 8653 West Ave E is a home located in Los Angeles County with nearby schools including Del Sur Senior Elementary School and Lancaster High School.
Ownership History
Date
Name
Owned For
Owner Type
Purchase Details
Closed on
Sep 26, 2011
Sold by
Leeds Jeffrey B and Leeds Patricia A
Bought by
Lourito Philip John and Lourito Deborah Marie
Current Estimated Value
Home Financials for this Owner
Home Financials are based on the most recent Mortgage that was taken out on this home.
Original Mortgage
$296,293
Outstanding Balance
$200,558
Interest Rate
4.02%
Mortgage Type
FHA
Estimated Equity
$425,587
Purchase Details
Closed on
Apr 23, 1996
Sold by
Transamerica Financial Services
Bought by
Lees Jefrrey B and Leeds Patricia A
Home Financials for this Owner
Home Financials are based on the most recent Mortgage that was taken out on this home.
Original Mortgage
$124,200
Interest Rate
7.8%
Purchase Details
Closed on
Nov 28, 1995
Sold by
Delosua James A and Delosua Susan M
Bought by
Transamerica Financial Services
Purchase Details
Closed on
Apr 20, 1995
Sold by
Delosua James A and Delosua Susan M
Bought by
New England Financial Corp
Create a Home Valuation Report for This Property
The Home Valuation Report is an in-depth analysis detailing your home's value as well as a comparison with similar homes in the area
Home Values in the Area
Average Home Value in this Area
Purchase History
| Date | Buyer | Sale Price | Title Company |
|---|---|---|---|
| Lourito Philip John | $304,000 | Fidelity National Title Co | |
| Lees Jefrrey B | $138,000 | -- | |
| Transamerica Financial Services | $117,117 | -- | |
| New England Financial Corp | -- | -- |
Source: Public Records
Mortgage History
| Date | Status | Borrower | Loan Amount |
|---|---|---|---|
| Open | Lourito Philip John | $296,293 | |
| Previous Owner | Lees Jefrrey B | $124,200 |
Source: Public Records
Tax History
| Year | Tax Paid | Tax Assessment Tax Assessment Total Assessment is a certain percentage of the fair market value that is determined by local assessors to be the total taxable value of land and additions on the property. | Land | Improvement |
|---|---|---|---|---|
| 2025 | $4,762 | $381,829 | $100,478 | $281,351 |
| 2024 | $4,762 | $374,343 | $98,508 | $275,835 |
| 2023 | $4,720 | $367,004 | $96,577 | $270,427 |
| 2022 | $4,636 | $359,809 | $94,684 | $265,125 |
| 2021 | $4,549 | $352,755 | $92,828 | $259,927 |
| 2019 | $7,171 | $342,294 | $90,076 | $252,218 |
| 2018 | $4,374 | $335,583 | $88,310 | $247,273 |
| 2016 | $4,104 | $322,554 | $84,882 | $237,672 |
| 2015 | $4,049 | $317,709 | $83,607 | $234,102 |
| 2014 | $4,023 | $311,487 | $81,970 | $229,517 |
Source: Public Records
Map
Nearby Homes
- 0 W Ave D14 Vic 90 Stw Ave
- 190 W Avenue D 10
- 8320 W Avenue d10
- 0 Vac Ave G Vic 125 Stw Unit PW26016136
- 0 Vac 80 Stw Vic Avenue F6 Unit SR16757287
- 0 Vac Vic Avenue G10 110 Stw Unit SR25252975
- 8347 W Avenue d10
- 8155 West Ave E
- 47922 85th St W
- 183 Avenue E-8
- 0 Ave E-11 Unit SR25159695
- 8200 15 W Avenue D 6
- 5600 W Avenue D 6
- 8727 W Avenue e12
- 8016 W Avenue d12
- 48225 93rd St W
- 90 W Stw Vic Avenue E12
- 93 93 Stw Vic E6 Ave Unit D6
- 48038 93rd St W
- 8346 W Avenue d4
- 8653 W Avenue E
- 8653 W Avenue E
- 0 Ave E-12 & Near 87th St W
- 48430 87th St W
- 8705 W Avenue E Unit E8
- 8662 W Avenue E
- 8640 W Avenue E
- 8585 W Avenue E
- 8711 W Avenue E
- 48435 87th St W
- 8711 West Ave E
- 8628 W Avenue E
- 8628 W Avenue E
- 8628 West Ave E
- 8615 W Avenue C
- 8722 W Avenue E
- 8722 W Avenue E
- 8540 W Avenue E
- 8621 W Avenue d14
- 8545 W Avenue E
Your Personal Tour Guide
Ask me questions while you tour the home.