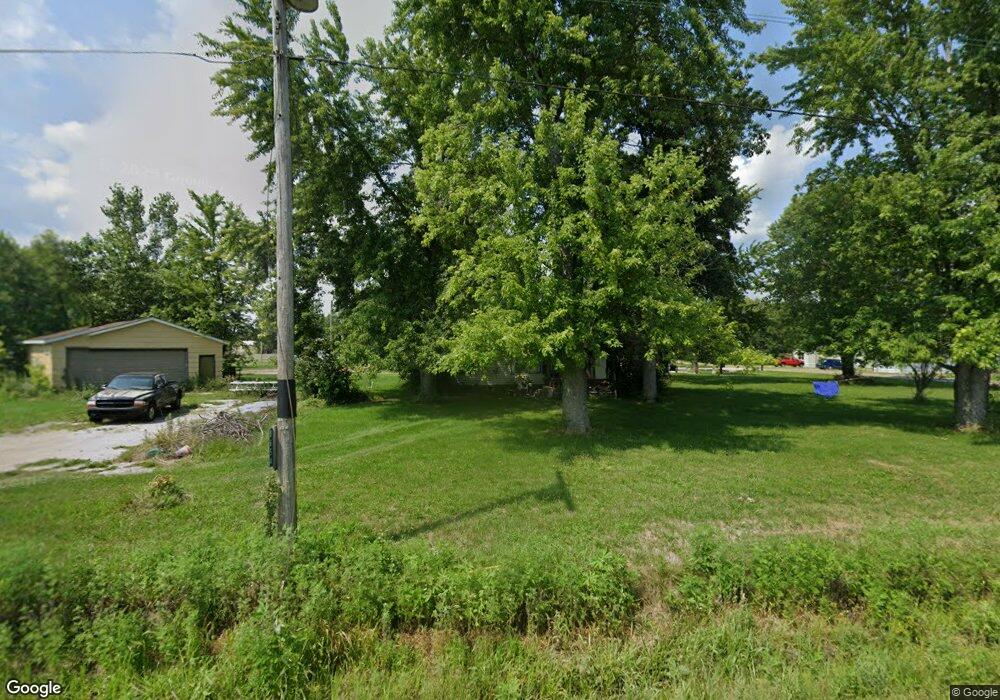
8654 E 1400th Ave Effingham, IL 62401
Estimated Value: $33,846 - $272,000
3
Beds
2
Baths
1,012
Sq Ft
$152/Sq Ft
Est. Value
About This Home
This home is located at 8654 E 1400th Ave, Effingham, IL 62401 and is currently estimated at $153,462, approximately $151 per square foot. 8654 E 1400th Ave is a home located in Effingham County with nearby schools including South Side Grade School, Early Learning Center, and Central Grade School.
Ownership History
Date
Name
Owned For
Owner Type
Purchase Details
Closed on
Sep 20, 2024
Sold by
Lukens Harold J and Lukens Charlotte M
Bought by
Cpw Properties Llc
Current Estimated Value
Purchase Details
Closed on
Aug 12, 2011
Sold by
Field Justin J and Field Nicole L
Bought by
Lukens Harold J and Lukens Charlotte M
Home Financials for this Owner
Home Financials are based on the most recent Mortgage that was taken out on this home.
Original Mortgage
$53,000
Interest Rate
4.55%
Mortgage Type
New Conventional
Purchase Details
Closed on
May 9, 2005
Sold by
Speer Jeffrey K
Bought by
Field Justin J
Home Financials for this Owner
Home Financials are based on the most recent Mortgage that was taken out on this home.
Original Mortgage
$52,000
Interest Rate
5.6%
Mortgage Type
New Conventional
Create a Home Valuation Report for This Property
The Home Valuation Report is an in-depth analysis detailing your home's value as well as a comparison with similar homes in the area
Home Values in the Area
Average Home Value in this Area
Purchase History
| Date | Buyer | Sale Price | Title Company |
|---|---|---|---|
| Cpw Properties Llc | $96,000 | The Title Center | |
| Lukens Harold J | -- | None Available | |
| Field Justin J | $65,000 | None Available |
Source: Public Records
Mortgage History
| Date | Status | Borrower | Loan Amount |
|---|---|---|---|
| Previous Owner | Lukens Harold J | $53,000 | |
| Previous Owner | Field Justin J | $52,000 |
Source: Public Records
Tax History Compared to Growth
Tax History
| Year | Tax Paid | Tax Assessment Tax Assessment Total Assessment is a certain percentage of the fair market value that is determined by local assessors to be the total taxable value of land and additions on the property. | Land | Improvement |
|---|---|---|---|---|
| 2024 | $1,391 | $31,440 | $7,270 | $24,170 |
| 2023 | $1,268 | $28,450 | $6,580 | $21,870 |
| 2022 | $1,210 | $26,340 | $6,090 | $20,250 |
| 2021 | $1,135 | $25,090 | $5,800 | $19,290 |
| 2020 | $1,091 | $24,130 | $5,580 | $18,550 |
| 2019 | $1,062 | $23,430 | $5,420 | $18,010 |
| 2018 | $999 | $22,310 | $5,160 | $17,150 |
| 2017 | $969 | $21,870 | $5,060 | $16,810 |
| 2016 | $922 | $20,930 | $4,840 | $16,090 |
| 2015 | -- | $20,720 | $4,790 | $15,930 |
| 2014 | -- | $20,510 | $4,740 | $15,770 |
| 2013 | -- | $20,510 | $4,740 | $15,770 |
| 2012 | -- | $20,510 | $4,740 | $15,770 |
Source: Public Records
Map
Nearby Homes
- 8242 E Twin Oaks Dr
- 14689 N Court 6
- 15325 N Cardinal Ln
- 9284 E Court 11
- 15095 N Nees Ln
- 9219 E Best Ct
- 14744 N Court 1
- 14480 N 1025th St
- 14342 Sportsman's Dr
- 24 N Country Club Rd
- 15872 N Bluebird Dr
- 13120 Augusta National Dr
- 21 N Country Club Rd
- 9 N Country Club Rd
- 8 N Country Club Rd
- 15243 N Holden Ave
- 30 N Country Club Rd
- 12990 Country Club Rd
- 11107 E Cambridge Ln
- 15775 N Cobblestone Ct
- 14035 N Romany Ln
- 8616 E 1400th Ave
- 14014 Romany Acres
- 14048 N John Birch Ln
- 14014 N Romany Ln
- 0 Romany Ln
- 14072 N John Birch Ln
- 14072 John Birch Ln
- 14075 N Romany Ln
- 14011 N South Shore Dr
- 14100 N John Birch Ln
- 14063 N South Shore Dr
- 14121 N Romany Ln
- LOT 21 E Shore Dr
- 8761 E 1400th Ave
- 14128 N John Birch Ln
- 14085 N Romany Ln
- 8560 E 1400th Ave
- 14123 N South Shore Dr
- 14154 N John Birch Ln