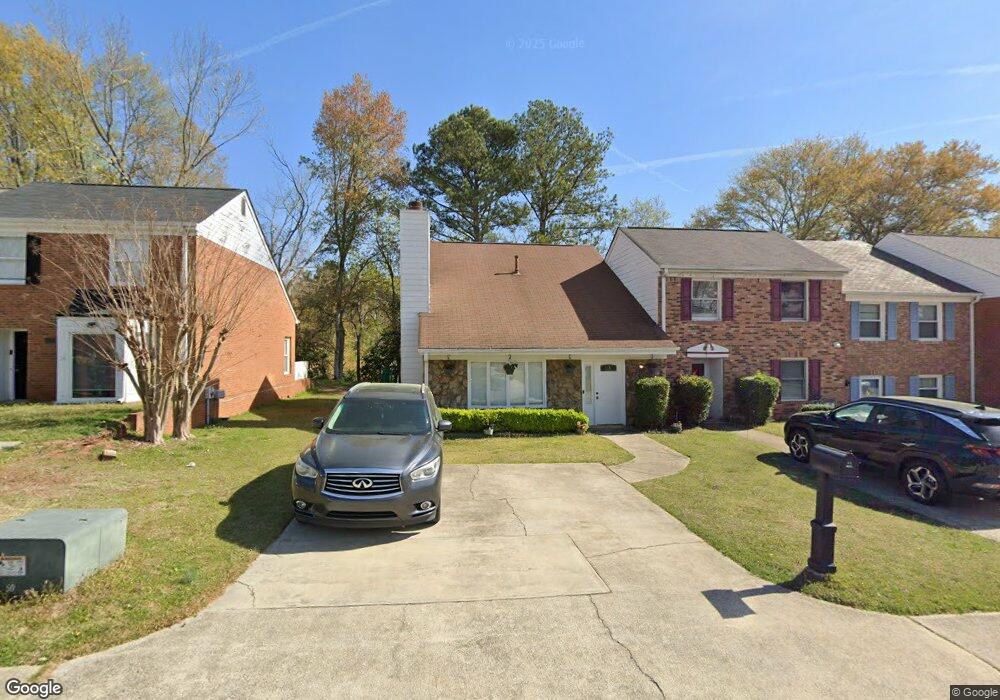
866 Baltimore Place SW Marietta, GA 30064
Estimated Value: $280,000 - $460,000
3
Beds
2
Baths
1,450
Sq Ft
$233/Sq Ft
Est. Value
About This Home
This home is located at 866 Baltimore Place SW, Marietta, GA 30064 and is currently estimated at $337,973, approximately $233 per square foot. 866 Baltimore Place SW is a home located in Cobb County with nearby schools including Cheatham Hill Elementary School, Smitha Middle School, and Osborne High School.
Ownership History
Date
Name
Owned For
Owner Type
Purchase Details
Closed on
Aug 27, 2008
Sold by
Hud & Housing Of Urban Dev
Bought by
Karanga Cyrus
Current Estimated Value
Home Financials for this Owner
Home Financials are based on the most recent Mortgage that was taken out on this home.
Original Mortgage
$63,569
Outstanding Balance
$41,650
Interest Rate
6.21%
Mortgage Type
FHA
Estimated Equity
$296,323
Purchase Details
Closed on
Dec 20, 2005
Sold by
Khalid Abdi
Bought by
Johnson Marcelle
Home Financials for this Owner
Home Financials are based on the most recent Mortgage that was taken out on this home.
Original Mortgage
$100,350
Interest Rate
6.28%
Mortgage Type
FHA
Purchase Details
Closed on
Feb 26, 1998
Sold by
Harrell Rebecca S
Bought by
Khalid Abdi
Home Financials for this Owner
Home Financials are based on the most recent Mortgage that was taken out on this home.
Original Mortgage
$72,105
Interest Rate
7.01%
Mortgage Type
New Conventional
Create a Home Valuation Report for This Property
The Home Valuation Report is an in-depth analysis detailing your home's value as well as a comparison with similar homes in the area
Home Values in the Area
Average Home Value in this Area
Purchase History
| Date | Buyer | Sale Price | Title Company |
|---|---|---|---|
| Karanga Cyrus | $58,000 | -- | |
| Johnson Marcelle | $102,000 | -- | |
| Khalid Abdi | $75,900 | -- |
Source: Public Records
Mortgage History
| Date | Status | Borrower | Loan Amount |
|---|---|---|---|
| Open | Karanga Cyrus | $63,569 | |
| Previous Owner | Johnson Marcelle | $100,350 | |
| Previous Owner | Khalid Abdi | $72,105 |
Source: Public Records
Tax History Compared to Growth
Tax History
| Year | Tax Paid | Tax Assessment Tax Assessment Total Assessment is a certain percentage of the fair market value that is determined by local assessors to be the total taxable value of land and additions on the property. | Land | Improvement |
|---|---|---|---|---|
| 2024 | $3,035 | $100,656 | $34,000 | $66,656 |
| 2023 | $2,607 | $86,484 | $28,000 | $58,484 |
| 2022 | $2,317 | $76,348 | $20,000 | $56,348 |
| 2021 | $1,671 | $55,060 | $20,000 | $35,060 |
| 2020 | $1,250 | $41,188 | $14,000 | $27,188 |
| 2019 | $1,250 | $41,188 | $14,000 | $27,188 |
| 2018 | $1,126 | $37,092 | $12,000 | $25,092 |
| 2017 | $568 | $19,764 | $3,200 | $16,564 |
| 2016 | $568 | $19,764 | $3,200 | $16,564 |
| 2015 | $497 | $16,860 | $6,000 | $10,860 |
| 2014 | $501 | $16,860 | $0 | $0 |
Source: Public Records
Map
Nearby Homes
- 845 Lake Hollow Blvd SW
- 841 Lake Hollow Blvd SW Unit 9
- 836 Lake Hollow Blvd SW Unit 38
- 766 Reeves Lake Dr SW
- 730 Reeves Lake Dr SW
- 1315 Old Coach Rd SW
- 1010 Wesley Park Dr SW
- 1305 Surrey Ln SW
- 1346 Old Coach Rd SW
- 1300 Surrey Ln SW
- 1355 Old Coach Rd SW
- 1351 Old Coach Rd SW
- 1382 Old Coach Rd SW
- 959 Laurel Springs Ln SW
- 963 Bolingbrook Dr SW
- 1383 Natchez Trace SW
- 1116 Arden Dr SW
- 862 Baltimore Place SW
- 868 Baltimore Place SW
- 860 Baltimore Place SW
- 860 Baltimore Place SW Unit 860
- 870 Baltimore Place SW
- 858 Baltimore Place SW
- 872 Baltimore Place SW
- 0 Baltimore Place SW Unit 7048198
- 0 Baltimore Place SW Unit 7029283
- 0 Baltimore Place SW Unit 3211195
- 0 Baltimore Place SW Unit 8754850
- 0 Baltimore Place SW Unit 8326598
- 0 Baltimore Place SW Unit 8153448
- 0 Baltimore Place SW Unit 7178095
- 0 Baltimore Place SW Unit 8199519
- 0 Baltimore Place SW Unit 9044241
- 0 Baltimore Place SW
- 856 Baltimore Place SW Unit 856
- 856 Baltimore Place SW
- 854 Baltimore Place SW