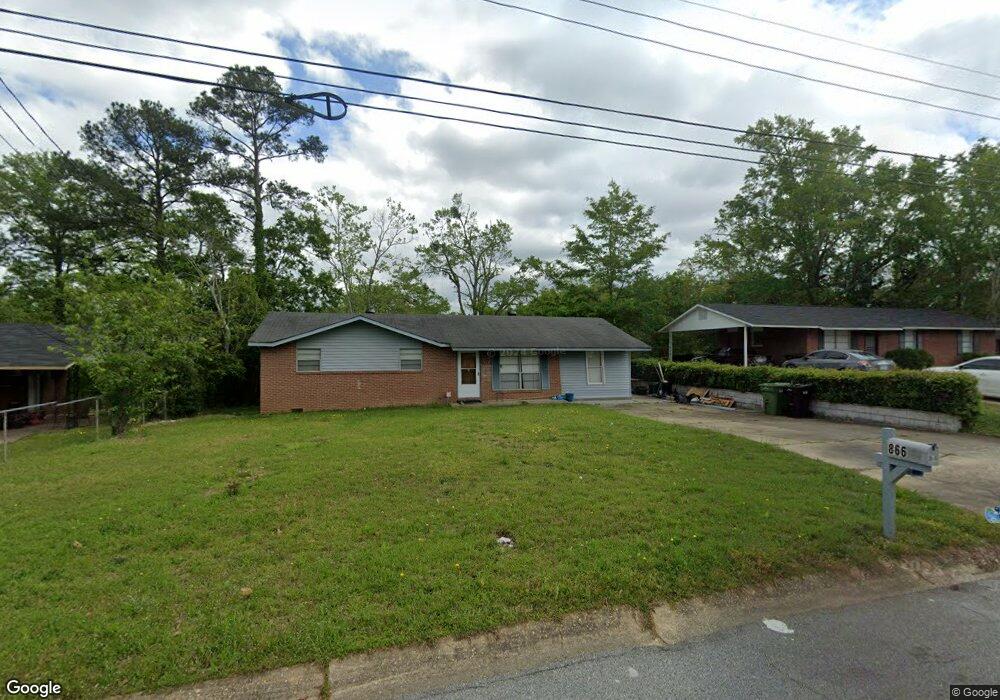
866 Baxley Way Columbus, GA 31907
Eastern Columbus NeighborhoodEstimated Value: $103,684 - $119,000
3
Beds
2
Baths
1,248
Sq Ft
$91/Sq Ft
Est. Value
About This Home
This home is located at 866 Baxley Way, Columbus, GA 31907 and is currently estimated at $113,671, approximately $91 per square foot. 866 Baxley Way is a home located in Muscogee County with nearby schools including Lonnie Jackson Academy, East Columbus Magnet Academy, and Kendrick High School.
Ownership History
Date
Name
Owned For
Owner Type
Purchase Details
Closed on
Oct 24, 2019
Sold by
Strawder Tammy D
Bought by
Scarbrough Kathy Isaacson
Current Estimated Value
Home Financials for this Owner
Home Financials are based on the most recent Mortgage that was taken out on this home.
Original Mortgage
$52,040
Outstanding Balance
$45,701
Interest Rate
3.62%
Mortgage Type
FHA
Estimated Equity
$67,970
Purchase Details
Closed on
Oct 26, 2012
Sold by
Strawder Tammy D
Bought by
Strawder Jeffery A
Home Financials for this Owner
Home Financials are based on the most recent Mortgage that was taken out on this home.
Original Mortgage
$42,000
Interest Rate
2.76%
Mortgage Type
New Conventional
Purchase Details
Closed on
Aug 29, 2012
Sold by
Smith Essie Eugenia
Bought by
Strawder Tammy D
Home Financials for this Owner
Home Financials are based on the most recent Mortgage that was taken out on this home.
Original Mortgage
$42,000
Interest Rate
2.76%
Mortgage Type
New Conventional
Create a Home Valuation Report for This Property
The Home Valuation Report is an in-depth analysis detailing your home's value as well as a comparison with similar homes in the area
Home Values in the Area
Average Home Value in this Area
Purchase History
| Date | Buyer | Sale Price | Title Company |
|---|---|---|---|
| Scarbrough Kathy Isaacson | -- | -- | |
| Strawder Jeffery A | -- | -- | |
| Strawder Tammy D | -- | -- |
Source: Public Records
Mortgage History
| Date | Status | Borrower | Loan Amount |
|---|---|---|---|
| Open | Scarbrough Kathy Isaacson | $52,040 | |
| Previous Owner | Strawder Jeffery A | $42,000 |
Source: Public Records
Tax History Compared to Growth
Tax History
| Year | Tax Paid | Tax Assessment Tax Assessment Total Assessment is a certain percentage of the fair market value that is determined by local assessors to be the total taxable value of land and additions on the property. | Land | Improvement |
|---|---|---|---|---|
| 2025 | $210 | $32,856 | $6,004 | $26,852 |
| 2024 | $209 | $30,528 | $6,004 | $24,524 |
| 2023 | $15 | $30,528 | $6,004 | $24,524 |
| 2022 | $217 | $24,264 | $6,004 | $18,260 |
| 2021 | $211 | $18,552 | $6,004 | $12,548 |
| 2020 | $211 | $18,552 | $6,004 | $12,548 |
| 2019 | $928 | $22,660 | $6,004 | $16,656 |
| 2018 | $928 | $22,660 | $6,004 | $16,656 |
| 2017 | $931 | $22,660 | $6,004 | $16,656 |
| 2016 | $1,298 | $31,469 | $2,856 | $28,613 |
| 2015 | $1,300 | $31,469 | $2,856 | $28,613 |
| 2014 | $1,301 | $31,469 | $2,856 | $28,613 |
| 2013 | -- | $31,469 | $2,856 | $28,613 |
Source: Public Records
Map
Nearby Homes
- 5526 Buena Vista Rd
- 5532 Buena Vista Rd
- 752 Wilder Dr
- 727 Wilder Dr
- 719 Wilder Dr
- 4722 Pollman St
- 736 Belvedere Dr
- 5529 Pollman St
- 822 Reaper Ln
- 558 Wilder Dr
- 5542 Teresa St
- 908 Arlington Dr
- 4731 Marino St
- 5828 Georgetown Dr
- 5235 Vincent Dr
- 702 Corley Dr
- 4935 Buena Vista Rd
- 4903 Chapman St
- 650 Upland Ct
- 5035 Gibbs Dr
- 870 Baxley Way
- 862 Baxley Way
- 858 Baxley Way
- 5432 Buena Vista Rd
- 5432 & 5440 Buena Vista Rd
- 874 Baxley Way
- 865 Baxley Way
- 869 Baxley Way
- 861 Baxley Way
- 854 Baxley Way
- 873 Baxley Way
- 878 Baxley Way
- 857 Baxley Way
- 877 Baxley Way
- 850 Baxley Way
- 853 Baxley Way
- 5422 Buena Vista Rd
- 882 Baxley Way
- 887 Baxley Way
- 864 Belvedere Dr